Tag the questions with any skills you have. Your dashboard will track each student's mastery of each skill.
Give this quiz to my class
Q 1/22
Score 0
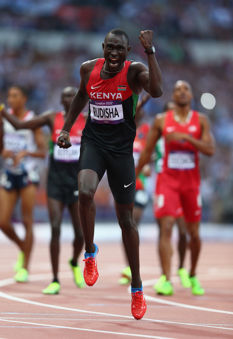
David runs the 800m race. He completes it in a time of 140s. What is his average speed in m/s?
60
0.175
5.7
112000
940
Q 2/22
Score 0
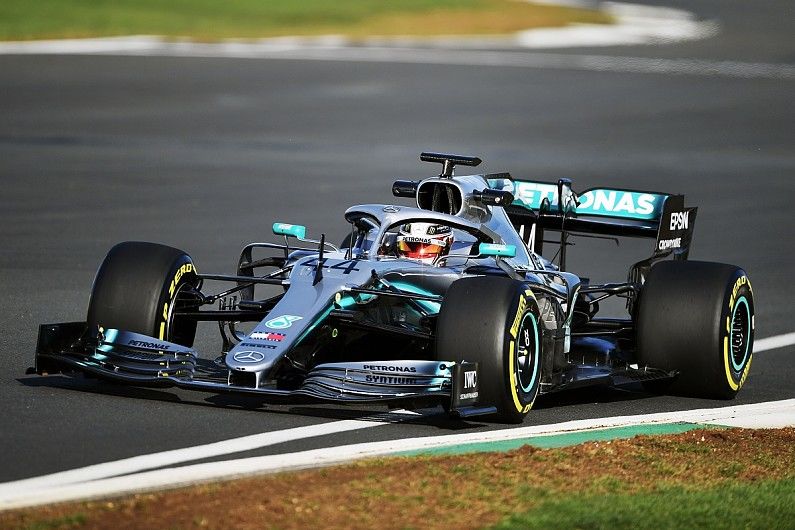
Lewis completes 1 lap of the Silverstone race track with an average speed of 63m/s. The track is 5.9km long. How long does he take to complete 1 lap in seconds?
60
371.7
68.9
94
10.6
22 questions
Q.
David runs the 800m race. He completes it in a time of 140s. What is his average speed in m/s?
1
60 sec
Q.
Lewis completes 1 lap of the Silverstone race track with an average speed of 63m/s. The track is 5.9km long. How long does he take to complete 1 lap in seconds?
2
60 sec
Q.
Eddie flies through the air with a speed of 26m/s. He is in the air for 2.2s. How far does he travel in metres?
3
60 sec
Q.
The distance time graph shows the movement of a dog chasing a ball. How is the dog moving between A and B
4
60 sec
Q.
How is the dog moving between B an C
5
60 sec
Q.
What is different about the dog's movement between A-B and C-D?
6
60 sec
Q.
What is the average speed of the dog between A-B in m/s?
7
60 sec
Q.
What is the total distance travelled by the dog in metres?
8
60 sec
Q.
What is the average speed of the dog between A and E in m/s?
9
60 sec
Q.
When he lights the fuse Wile E Coyote accelerates from rest to 30m/s in 4s. What is his acceleration in m/s^2?
10
60 sec
Q.
As Mr Wilson overtakes a tractor he accelerates from 9m/s to 22m/s in 5 seconds. What is his acceleration in m/s^2?
11
60 sec
Q.
Which graphs show constant speed?
12
60 sec
Q.
Which graph shows acceleration?
13
60 sec
Q.
Which graph shows deceleration?
14
60 sec
Q.
Which graph show a stationary object?
15
60 sec
Q.
Which graph shows a higher constant speed than F?
16
60 sec
Q.
Which graph shows an object returning to the start point?
17
60 sec
Q.
Which section of the velocity time graph shows constant speed?
18
60 sec
Q.
Which part of the velocity time graph shows the greatest acceleration?
19
60 sec
Q.
Which part of the velocity time graph shows deceleration?
20
60 sec
Q.
What is the acceleration in m/s^2 in section C of the graph?
21
60 sec
Q.
What is the acceleration in m/s^2 in section A of the graph?