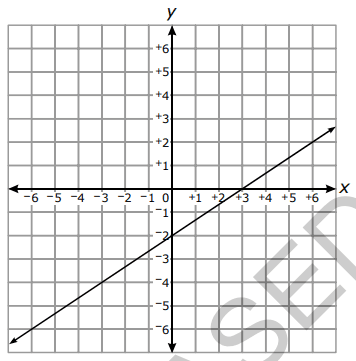
Analyze functions that model linear relationships. • Understand that a linear relationship can be generalized by 𝑦 = 𝑚𝑥 + 𝑏. • Write an equation in slope-intercept form to model a linear relationship by determining the rate of change and the initial value, given at least two (𝑥, 𝑦) values or a graph. • Construct a graph of a linear relationship given an equation in slope-intercept form. • Interpret the rate of change and initial value of a linear function in terms of the situation it models, and in terms of the slope and 𝑦- intercept of its graph or a table of values.
Compare properties of two linear functions each represented in a different way (algebraically, graphically, numerically in tables, or by verbal descriptions).
Construct and interpret scatter plots for bivariate measurement data to investigate patterns of association between two quantities. Investigate and describe patterns such as clustering, outliers, positive or negative association, linear association, and nonlinear association.
Understand that every number has a decimal expansion. Building upon the definition of a rational number, know that an irrational number is defined as a non-repeating, non-terminating decimal.
Identify linear functions from tables, equations, and graphs.
Use the equation of a linear model to solve problems in the context of bivariate quantitative data, interpreting the slope and 𝑦-intercept.
Use square root and cube root symbols to: • Represent solutions to equations of the form 𝑥 2 = 𝑝 and 𝑥 3 = 𝑝, where 𝑝 is a positive rational number. • Evaluate square roots of perfect squares and cube roots of perfect cubes for positive numbers less than or equal to 400.
Use rational approximations of irrational numbers to compare the size of irrational numbers and locate them approximately on a number line. Estimate the value of expressions involving: • Square roots and cube roots to the tenths. • 𝜋 to the hundredths.
Use informal arguments to analyze angle relationships. • Recognize relationships between interior and exterior angles of a triangle. • Recognize the relationships between the angles created when parallel lines are cut by a transversal. • Recognize the angle-angle criterion for similarity of triangles. • Solve real-world and mathematical problems involving angles.
Solve real-world and mathematical problems by writing and solving equations and inequalities in one variable. • Recognize linear equations in one variable as having one solution, infinitely many solutions, or no solutions. • Solve linear equations and inequalities including multi-step equations and inequalities with the same variable on both sides.
Perform multiplication and division with numbers expressed in scientific notation to solve real-world problems, including problems where both decimal and scientific notation are used.
Apply the Pythagorean Theorem and its converse to solve real-world and mathematical problems.
Understand how the formulas for the volumes of cones, cylinders, and spheres are related and use the relationship to solve real-world and mathematical problems.
Model the relationship between bivariate quantitative data to: • Informally fit a straight line for a scatter plot that suggests a linear association. • Informally assess the model fit by judging the closeness of the data points to the line.
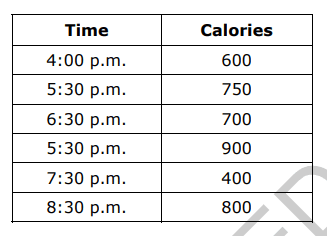
Understand that a function is a rule that assigns to each input exactly one output. • Recognize functions when graphed as the set of ordered pairs consisting of an input and exactly one corresponding output. • Recognize functions given a table of values or a set of ordered pairs.
Qualitatively analyze the functional relationship between two quantities. • Analyze a graph determining where the function is increasing or decreasing; linear or nonlinear. • Sketch a graph that exhibits the qualitative features of a real-world function.
Analyze and solve a system of two linear equations in two variables in slope-intercept form. • Understand that solutions to a system of two linear equations correspond to the points of intersection of their graphs because the point of intersection satisfies both equations simultaneously. • Solve real-world and mathematical problems leading to systems of linear equations by graphing the equations. Solve simple cases by inspection.
Describe the effect of dilations about the origin, translations, rotations about the origin in 90 degree increments, and reflections across the 𝑥- axis and 𝑦-axis on two-dimensional figures using coordinates.
Understand that patterns of association can also be seen in bivariate categorical data by displaying frequencies and relative frequencies in a two-way table. • Construct and interpret a two-way table summarizing data on two categorical variables collected from the same subjects. • Use relative frequencies calculated for rows or columns to describe possible association between the two variables.
Apply the Pythagorean Theorem to find the distance between two points in a coordinate system.
Use numbers expressed in scientific notation to estimate very large or very small quantities and to express how many times as much one is than the other.
Track each student's skills and progress in your Mastery dashboards