

Graphing
Quiz by Jessica Mandujano
Feel free to use or edit a copy
includes Teacher and Student dashboards
Measure skillsfrom any curriculum
Measure skills
from any curriculum
Tag the questions with any skills you have. Your dashboard will track each student's mastery of each skill.
With a free account, teachers can
- edit the questions
- save a copy for later
- start a class game
- automatically assign follow-up activities based on students’ scores
- assign as homework
- share a link with colleagues
- print as a bubble sheet
- Q 1/8Score 0
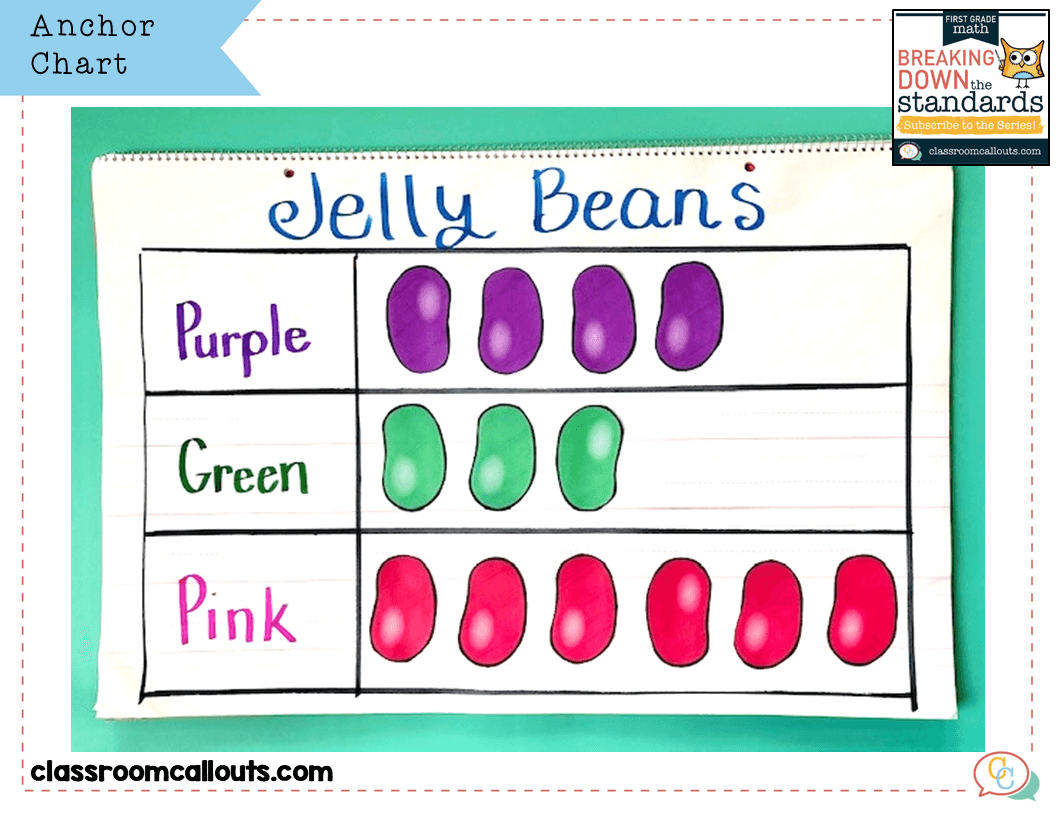
How many jelly beans are purple?
293
5
2
4


8 questions
Show answers
- Q1
How many jelly beans are purple?
3
5
2
4
30s - Q2
How many more pink jelly beans than green jelly beans?
4
3
2
6
30s - Q3
Which one is a bar graph?
#05cb008b-17ad-4933-8555-5bef2073a395/question/e094d760522226eefdba5a7f88c93588a886ede9.jfif#05cb008b-17ad-4933-8555-5bef2073a395/question/43ce36cd33d3345d28d31dfafc9cbe00f9411d56.webp30s - Q4
Why is this called a picture graph?
has tallies
it has different sports
has pictures
it is a graph
30s - Q5
A picture graph should have a ___________?
bar
word
key
mark
30s - Q6
How many jelly beans in all?
13
14
10
4
30s - Q7
What was the favorite animal of the class?
tiger
giraffe
elephant
deer
30s - Q8
Which animal had the least votes?
giraffe and elephant
giraffe
elephant
deer and giraffe
30s


