Tag the questions with any skills you have. Your dashboard will track each student's mastery of each skill.
Give this quiz to my class
Q 1/3
Score 0
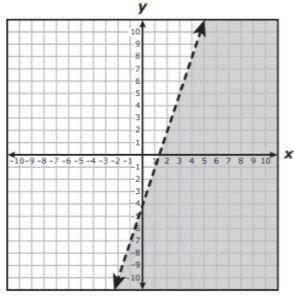
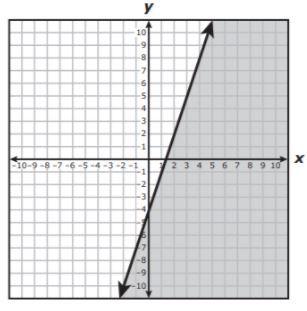
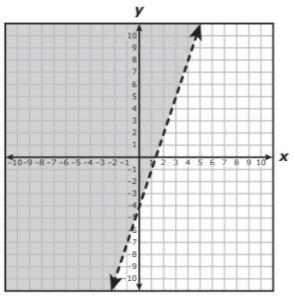
Which graph best represents the solution set of y > 3x - 4?
30
Q 2/3
Score 0
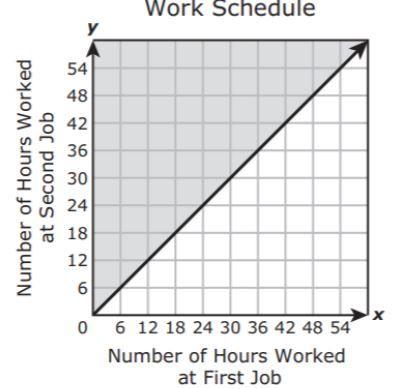
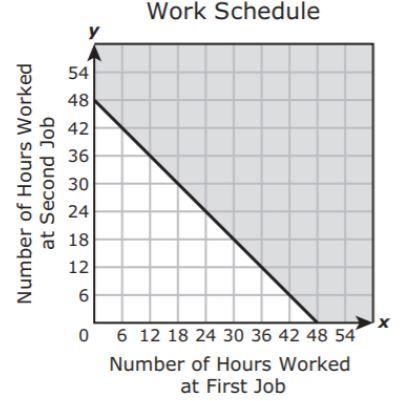
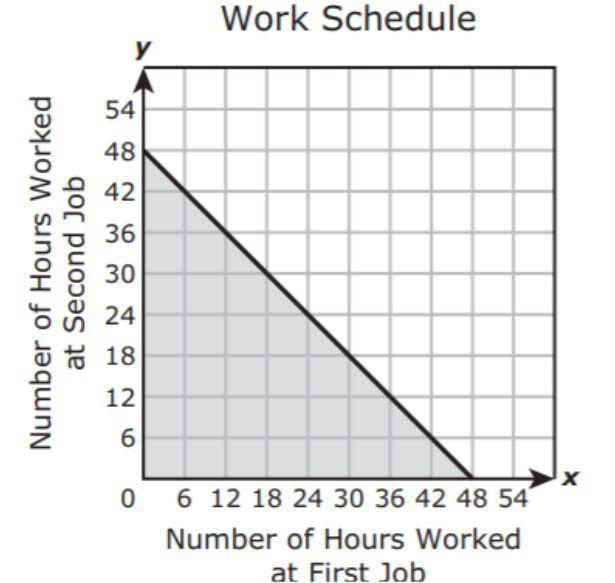
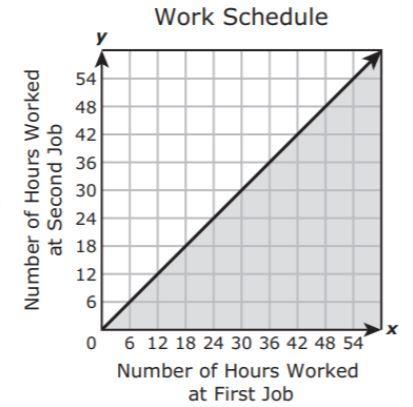
A college student has two different jobs. Her combined work schedules consist of no more than 48 hours in one week.
Which graph best represents the solution set for all possible combinations of x, the number of hours she worked at he first job, and y, the number of hours she worked at her second job, in one week?
30
3 questions
Q.
Which graph best represents the solution set of y > 3x - 4?
1
30 sec
Q.
A college student has two different jobs. Her combined work schedules consist of no more than 48 hours in one week.
Which graph best represents the solution set for all possible combinations of x, the number of hours she worked at he first job, and y, the number of hours she worked at her second job, in one week?
2
30 sec
Q.
Which graph best represents the solution set of -4x < 6y - 54?