Loading...
graphs and organizers
Quiz by Janica Dabu
Customize this quiz to suit your class
Instantly translate to 100+ languages
Tag the questions with any skills you have. Your dashboard will track each student's mastery of each skill.
Give this quiz to my class
1. also known as a horizontal column chart, is popular for a reason — it’s easy on the eyes. With this charts, you can quickly identify which bar is the highest or the lowest

B. pie graph
C. line graph
D. area graph
A. bar graph
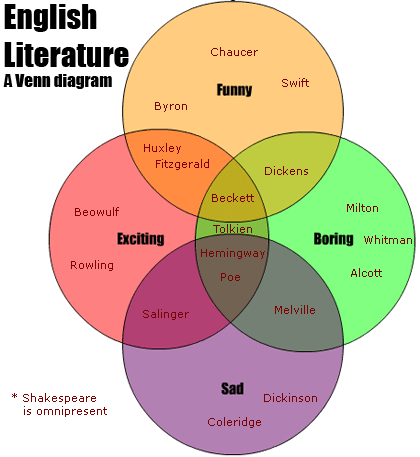
2. this diagram uses overlapping circles or other shapes to illustrate the logical relationships between two or more sets of items
C. flow chart
D. pictograph
A. venn diagram
B. mind map
1. also known as a horizontal column chart, is popular for a reason — it’s easy on the eyes. With this charts, you can quickly identify which bar is the highest or the lowest

2. this diagram uses overlapping circles or other shapes to illustrate the logical relationships between two or more sets of items

3. this diagram also known as dendrograms, are often presented with a parent node at the top and child nodes beneath or a parent node to the left and child nodes to the right. They can be simple or complex, depending on the information.
4. a diagram that visualizes a process or workflow, often one that has multiple turning points or paths. Typically, you use boxes or shapes to represent different steps in a process, and then you connect those steps with lines or arrows.
5. defined as a graphical representation of a problem-solving process. The diagram involves writing the essence of the problem in the beginning, then suggesting steps for resolving it, and finally coming up with a solution.
6. this is also known as fishbone diagram. A diagram is a visual tool used to logically organize possible causes for a specific problem or effect by graphically displaying them in increasing detail