Make a line plot to display a data set of measurements in fractions of a unit (1/2, 1/4, 1/8). Use operations on fractions for this grade to solve problems involving information presented in line plots. For example, given different measurements of liquid in identical beakers, find the amount of liquid each beaker would contain if the total amount in all the beakers were redistributed equally.
Track each student's skills and progress in your Mastery dashboards
Loading...
Loading...
Loading...
Give this quiz to my class
Q 1/2
Score 0
60
Q 2/2
Score 0
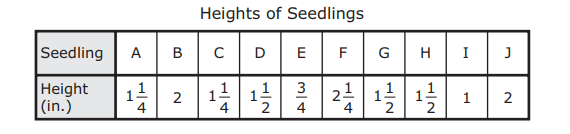
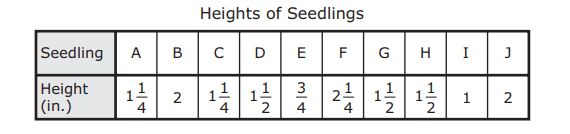
The table shows the heights of 10 seedlings. Which dot plot represents these data?
60
2 questions
Q.
1
60 sec
MGSE5.MD.2
Q.
The table shows the heights of 10 seedlings. Which dot plot represents these data?