Construct and interpret scatter plots for bivariate measurement data to investigate patterns of association between two quantities. Describe patterns such as clustering, outliers, positive or negative association, linear association, and nonlinear association
Track each student's skills and progress in your Mastery dashboards
Q 1/1
Score 0
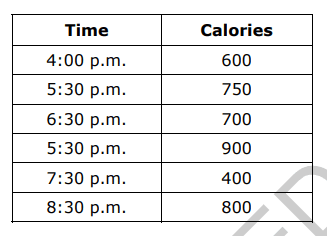
Susan recorded the time she ate dinner and the number of calories she consumed during dinner for six consecutive days. The results are shown in the table.
Which BEST describes the association between the time Susan ate dinner and the number of calories she consumed?
(*NO CALCULATOR*)
60
almost none
negative
positive
irrational
Loading...
Loading...
1 question
Q.
Susan recorded the time she ate dinner and the number of calories she consumed during dinner for six consecutive days. The results are shown in the table.
Which BEST describes the association between the time Susan ate dinner and the number of calories she consumed?
(*NO CALCULATOR*)