Know that straight lines are widely used to model relationships between two quantitative variables. For scatter plots that suggest a linear association, informally fit a straight line, and informally assess the model fit by judging the closeness of the data points to the line.
Track each student's skills and progress in your Mastery dashboards
Loading...
Loading...
Give this quiz to my class
Q 1/2
Score 0
60
Q 2/2
Score 0
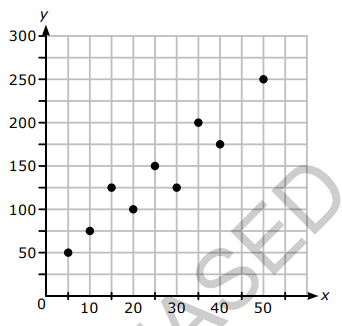
Henry made the scatterplot shown.
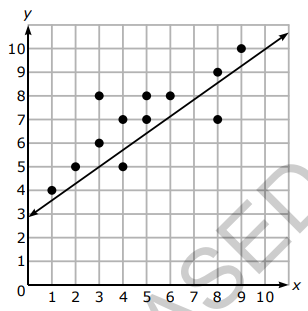
The scatterplot shows the data points, and it also shows the linear model that Henry drew. Which statement BEST describes the linear model?
60
The linear model does not describe the data well because the line does not go through any of the points.
The linear model describes the data well because points are scattered above and below the line.
The linear model describes the data well because all the points are close to the line.
The linear model does not describe the data well because most of the points are located above the line.
2 questions
Q.
1
60 sec
MGSE8.SP.2
Q.
Henry made the scatterplot shown.
The scatterplot shows the data points, and it also shows the linear model that Henry drew. Which statement BEST describes the linear model?