Analyze and interpret data to identify patterns in the relationships between speed and distance, and velocity and acceleration. (Clarification statement: Students should be able to analyze motion graphs, but students should not be expected to calculate velocity or acceleration.)
Track each student's skills and progress in your Mastery dashboards
Give this quiz to my class
Q 1/12
Score 0
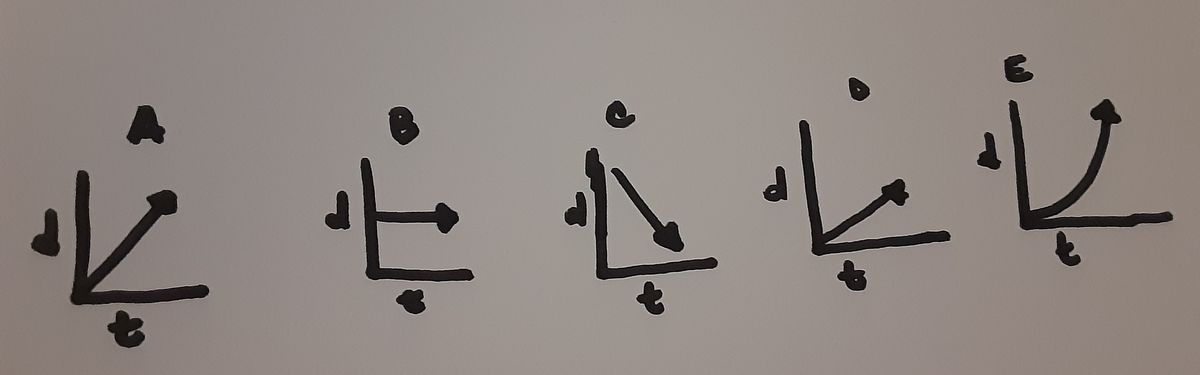
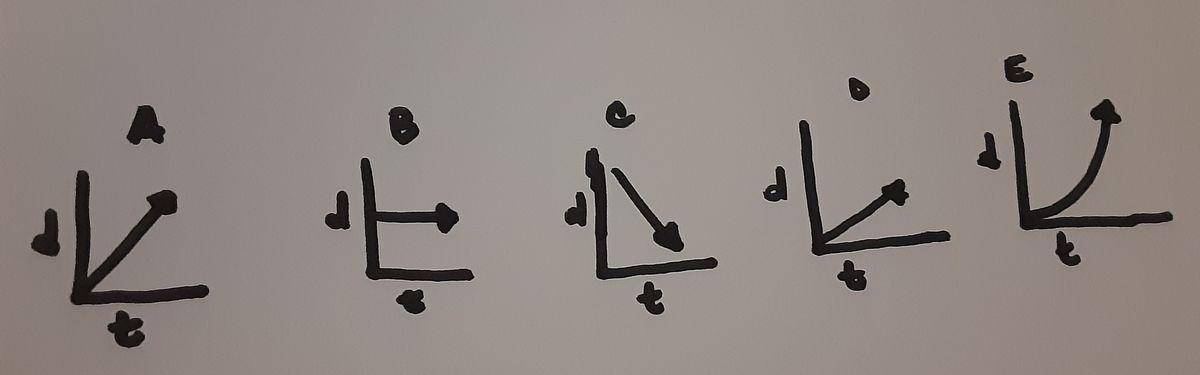
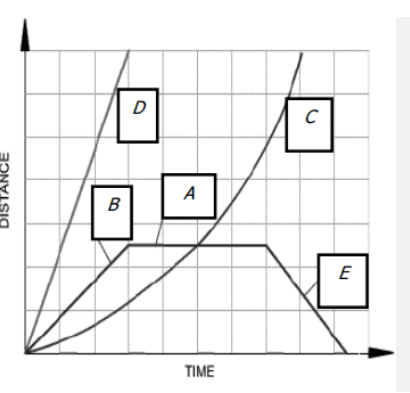
Which graph represents a change in direction or movement back?
60
A
B
C
E
Q 2/12
Score 0
Which graph represents a stopped motion?
60
C
B
D
A
12 questions
Q.
Which graph represents a change in direction or movement back?
1
60 sec
S8P3a
Q.
Which graph represents a stopped motion?
2
60 sec
S8P3a
Q.
When graph represents constant speed?
3
60 sec
S8P3a
Q.
Which graph represents acceleration or change motion?
4
60 sec
S8P3a
Q.
5
60 sec
S8P3a
Q.
6
60 sec
S8P3a
Q.
7
60 sec
S8P3a
Q.
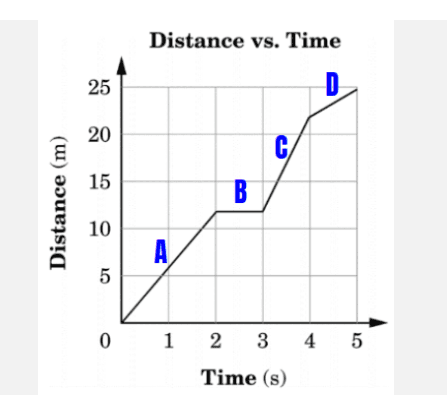
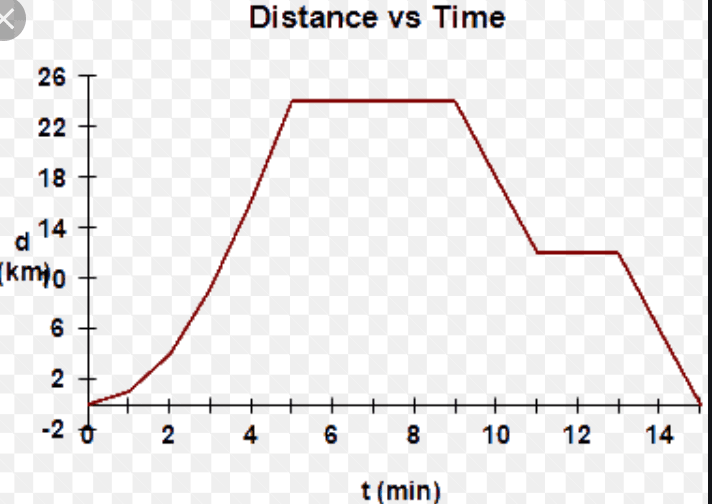
Which statement best summarizes the difference between sections C and D?
8
60 sec
S8P3a
Q.
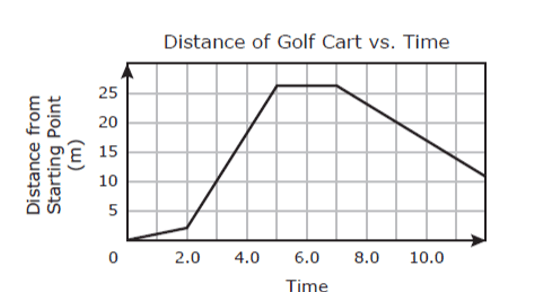
Which statement best summarizes the motion of the entire trip?
9
60 sec
S8P3a
Q.
10
60 sec
S8P3a
Q.
How is the first stop different from the last stop of motion?
11
60 sec
S8P3a
Q.
Which letters on the motion graph represent positive motion?