

Histograms
Quiz by Emily Reverman
Feel free to use or edit a copy
includes Teacher and Student dashboards
Measure skillsfrom any curriculum
Measure skills
from any curriculum
Tag the questions with any skills you have. Your dashboard will track each student's mastery of each skill.
With a free account, teachers can
- edit the questions
- save a copy for later
- start a class game
- automatically assign follow-up activities based on students’ scores
- assign as homework
- share a link with colleagues
- print as a bubble sheet
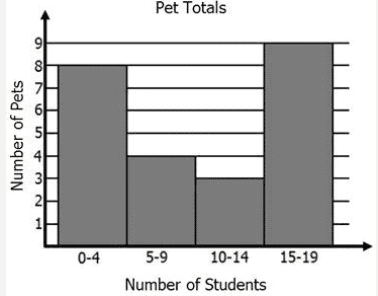
- Q 1/7Score 0Which interval shows the greatest number of pets?290 - 415 - 1910 -145 - 9


7 questions
Show answers
- Q1Which interval shows the greatest number of pets?0 - 415 - 1910 -145 - 930s
- Q2Describe the shape of this histogram.Skewed leftsymmetricalSkewed rightapproximately symmetrical30s
- Q3Describe the shape of this histogram.Approximately symmetricalSkewed leftSymmetricalSkewed right30s
- Q4What would be the center (mode) of this data set?45 - 4940 - 4460 - 6550 - 5430s
- Q5Describe the shape of this histogram.Skewed leftSkewed rightApproximately SymmetricalSymmetrical30s
- Q6What is the center of this data set?10 - 1940 - 4930 - 3920 - 2930s
- Q7What is the range of this data set?247610030s


