Interpret line plots
Quiz by Common Core - Grade 2
Feel free to use or edit a copy
includes Teacher and Student dashboards
Measure skillsfrom any curriculum
Measure skills
from any curriculum
Tag the questions with any skills you have. Your dashboard will track each student's mastery of each skill.
With a free account, teachers can
- edit the questions
- save a copy for later
- start a class game
- automatically assign follow-up activities based on students’ scores
- assign as homework
- share a link with colleagues
- print as a bubble sheet
10 questions
Show answers
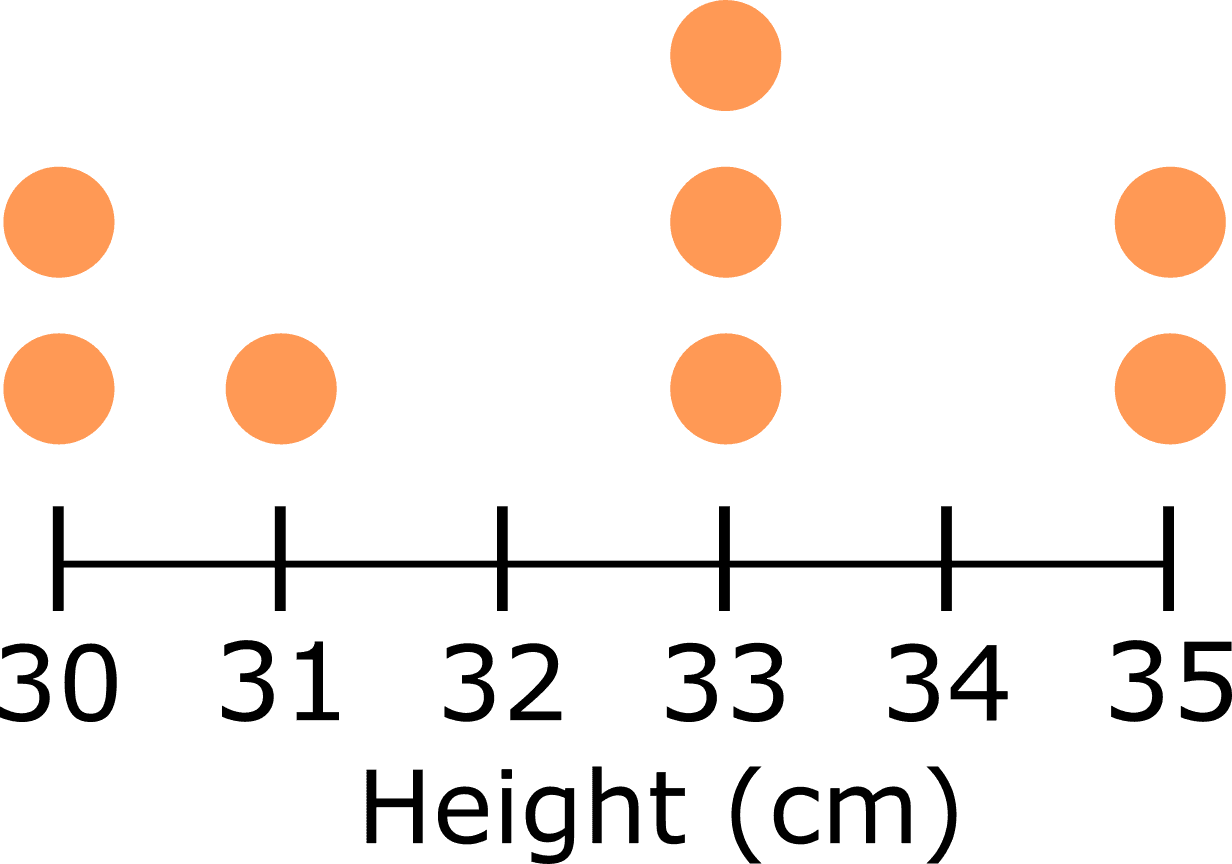
- Q1A class measured the height of plants as an experiment. Using this line plot, how many plants did the class measure?Users enter free textType an Answer30s
- Q2Jim was counting how many jelly babies were in a packet. He put his findings in a line plot. How many packets had less than 24 jelly babies?Users enter free textType an Answer30s
- Q3An interviewer asked a group of people at a concert their age, and made a line plot from the data. How many are 18 years old?Users enter free textType an Answer30s
- Q4A team of players each took 10 penalties and put the number of goals onto a line plot. How many scored more than 4 goals?Users enter free textType an Answer30s
- Q5An airline has a weight limit of 25kg. Here is a line plot of the weight some suitcases on the flight. How many are over the weight limit?Users enter free textType an Answer30s
- Q6A teacher asked a class to measure the length of a table with just a ruler. This line plot shows the results. How many measurements showed that the table was 120cm?Users enter free textType an Answer30s
- Q7Shoes found in a cupboard had sizes 5,7,7,5,8,9,4,5. How many points would you plot on a line plot for size 5?Users enter free textType an Answer30s
- Q8Sam flipped a coin until he got tails several times. He got 1,0,2,1,3,4,0,1,1 heads in a row. How many points would you plot for a line plot for 1 head in a row?Users enter free textType an Answer30s
- Q9Joyce played a game of golf and recorded her score. She scored 3,4,5,2,3,2,5,6,2 over the course. How many points would you plot on a line plot for a score of 3?Users enter free textType an Answer30s
- Q10Amanda and her friends played a mobile game and got scores of 4,5,6,1,7,9,7,2,5,5,7,7,3,7. How many points would you plot on a line plot for a score of 7?Users enter free textType an Answer30s
