Tag the questions with any skills you have. Your dashboard will track each student's mastery of each skill.
Give this quiz to my class
Q 1/10
Score 0
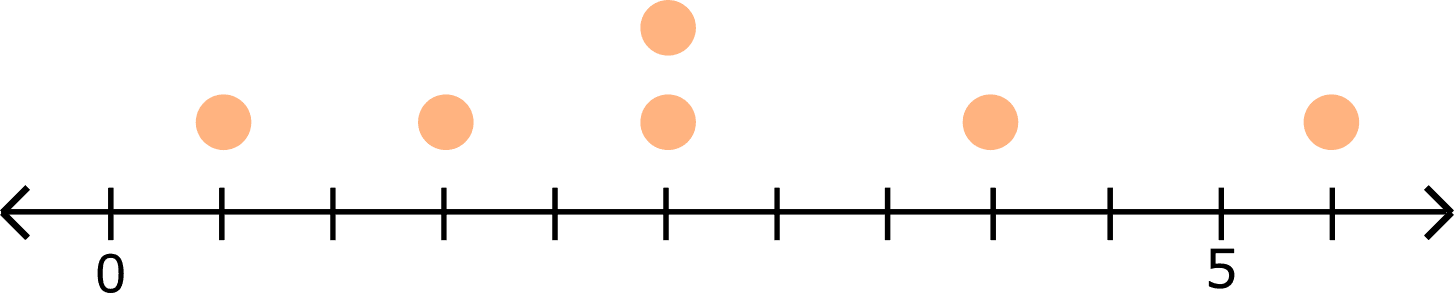
This is a line plot showing the number of cookies eaten by every child in a class. What is the difference between the highest number of cookies eaten and the lowest number?
30
Users enter free text
Q 2/10
Score 0
This is a line plot showing the amount of snow that fell each day during the Christmas break. How much more snow fell on the 2 heaviest days of snowfall compared to the 2 lightest days?
30
Users enter free text
10 questions
Q.
This is a line plot showing the number of cookies eaten by every child in a class. What is the difference between the highest number of cookies eaten and the lowest number?
1
30 sec
Q.
This is a line plot showing the amount of snow that fell each day during the Christmas break. How much more snow fell on the 2 heaviest days of snowfall compared to the 2 lightest days?
2
30 sec
Q.
This is a line plot showing the amount of orange juice finished every day. What is the total of the 3 highest volumes of orange juice consumed?
3
30 sec
Q.
This is a line plot showing the mass of every pupil's schoolbag in a class. How much do the 2 lightest bags weigh in total?
4
30 sec
Q.
This is a line plot showing the volume of milk every family on a street drinks in a day. What is the difference between the total drunk by the 2 families that drunk the most and the 3 families that drunk the least?
5
30 sec
Q.
This is a line plot showing the mass of some clay figurines found in a museum. What is the difference in weight between the 3 heaviest figurines and the 5 lightest figurines?