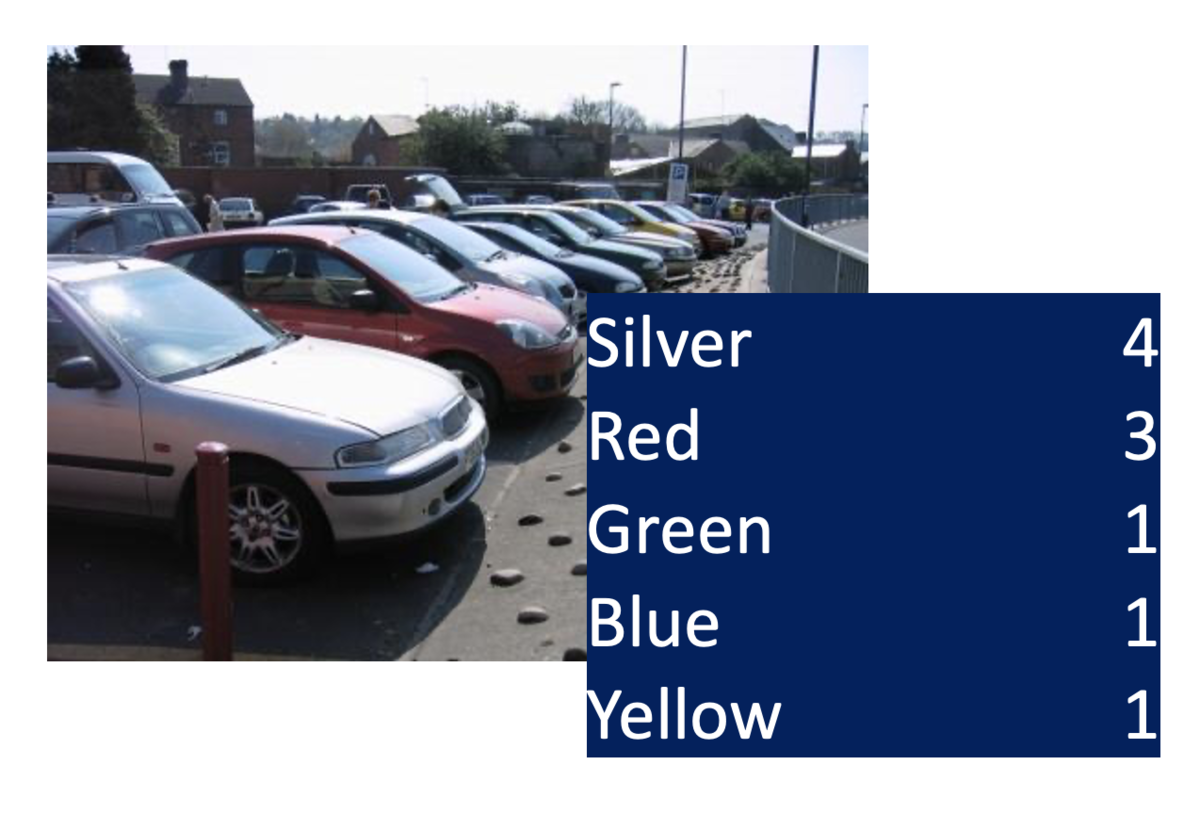
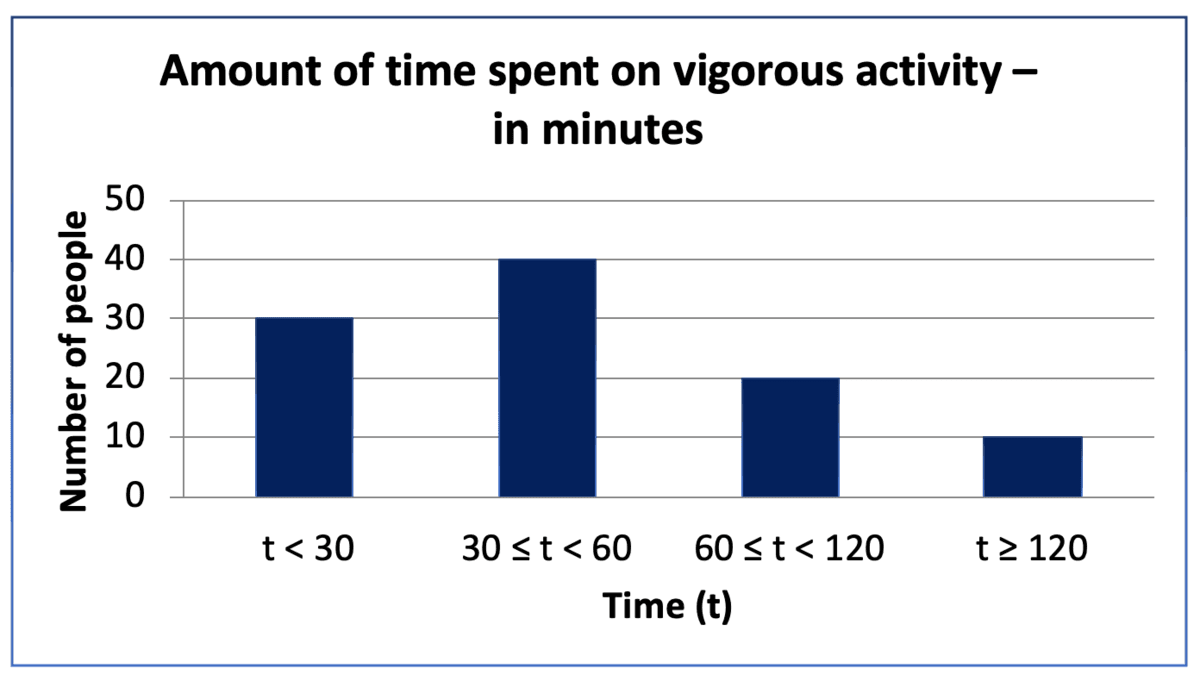
Construct and interpret appropriate tables, charts, and diagrams, including frequency tables, bar charts, pie charts, and pictograms for categorical data, and vertical line (or bar) charts for ungrouped and grouped numerical data.
Describe, interpret and compare observed distributions of a single variable through: appropriate graphical representation involving discrete, continuous and grouped data; and appropriate measures of central tendency (mean, mode, median) and spread (range, consideration of outliers).
Track each student's skills and progress in your Mastery dashboards