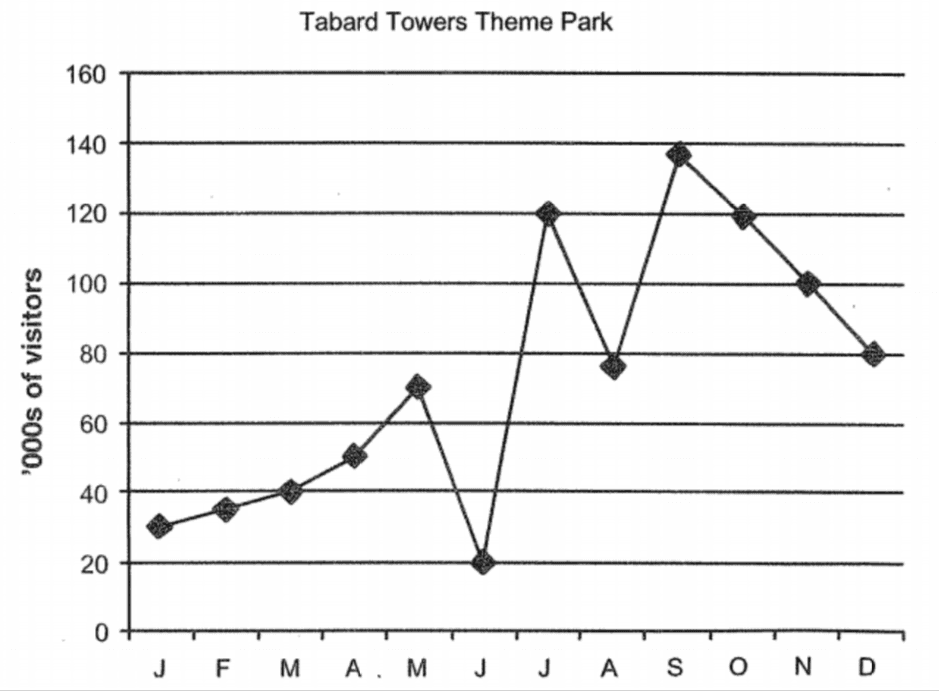
placeholder image to represent content

Line Graph T/F

Quiz by CBenham.sts

Feel free to use or edit a copy

includes Teacher and Student dashboards

Measure skills
from any curriculum

Tag the questions with any skills you have. Your dashboard will track each student's mastery of each skill.

With a free account, teachers can
  • edit the questions
  • save a copy for later
  • start a class game
  • view complete results in the Gradebook and Mastery Dashboards
  • automatically assign follow-up activities based on students’ scores
  • assign as homework
  • share a link with colleagues
  • print as a bubble sheet

Our brand new solo games combine with your quiz, on the same screen

Correct quiz answers unlock more play!

New Quizalize solo game modes
14 questions
Show answers
  • Q1
    In the last three months of the year, attendances were off their September peak, falling back by 30,000 visitors a month until the end of the year.
    Question Image
    False
    True
    30s
    Edit
    Delete
  • Q2
    During last year, the trend was obviously upwards.
    Question Image
    True
    False
    30s
    Edit
    Delete
  • Q3
    Numbers picked up in June, rocketing by almost 400%.
    Question Image
    False
    True
    30s
    Edit
    Delete
  • Q4
    There was a marked improvement in July with the number of visitors surging 500%.
    Question Image
    False
    True
    30s
    Edit
    Delete
  • Q5
    From May through to September, the number of people visiting the theme park monthly rose by approximately 70%.
    Question Image
    False
    True
    30s
    Edit
    Delete
  • Q6
    During the first four months, visitor numbers rose gradually.
    Question Image
    True
    False
    30s
    Edit
    Delete
  • Q7
    The gradual rise in visitor numbers from 30,000 to approximately 45,000 in the first four months was followed by a sharper increase in May.
    Question Image
    False
    True
    30s
    Edit
    Delete
  • Q8
    Between April and May, the increase in the number of visitors was at a much slower pace than in the previous three months.
    Question Image
    False
    True
    30s
    Edit
    Delete
  • Q9
    It is clear that for most of the year, monthly attendances were above trend.
    Question Image
    True
    False
    30s
    Edit
    Delete
  • Q10
    In July, the number of visitors shot up dramatically.
    Question Image
    False
    True
    30s
    Edit
    Delete
  • Q11
    In July, there was a dramatic increase in visitor numbers to just short of 140,000 people, followed by a sudden decline in August.
    Question Image
    False
    True
    30s
    Edit
    Delete
  • Q12
    August saw a sharp turnaround in attendances with numbers leaping from just under 80,000 to 140,000 people.
    Question Image
    True
    False
    30s
    Edit
    Delete
  • Q13
    The period between May and September saw a steady growth in the number of visitors from 70,000 to 140,000.
    Question Image
    True
    False
    30s
    Edit
    Delete
  • Q14
    Attendances at the theme park can be divided into three distinct periods: January to May, June to September, and October to December.
    Question Image
    False
    True
    30s
    Edit
    Delete

Teachers give this quiz to your class