Loading...

M5 Topic 5 Practice Test
Quiz by Fred Spies
Tag the questions with any skills you have. Your dashboard will track each student's mastery of each skill.
How many numbers belong to the interval 10 - 20 if the the data is organised in an exclusive continuous table?

All
None
3 numbers
2 numbers
"What is your favorite color"
The question above is an example of... (select all that applies)
How many numbers belong to the interval 10 - 20 if the the data is organised in an exclusive continuous table?

How many intervals are the numbers between 20 and 70 (exclusive) divided into?
500 Students were asked what their favorite past time is. How many students like to read books in their free time?

A survey was taken and one of the questions asked the participants their ages. How many people were surveyed?
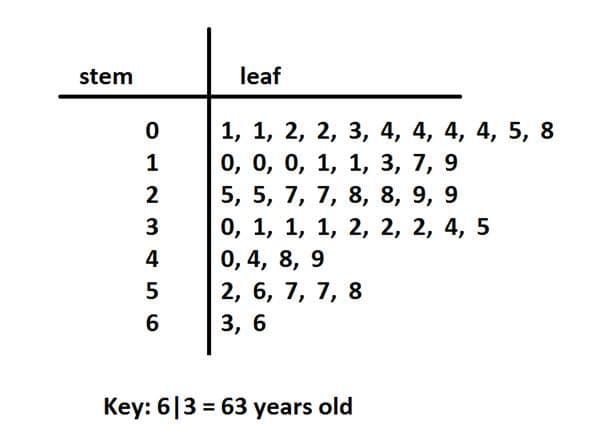
A survey was taken and one of the questions asked the participants their ages. How old was the oldest person?
A survey was taken and one of the questions asked the participants their ages. What is the median age of this group of people?
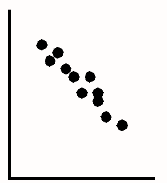
What kind of correlation describes the following trend line correctly?
What is the mean of the following?

What is the median of the following?
What is the mode of the following?
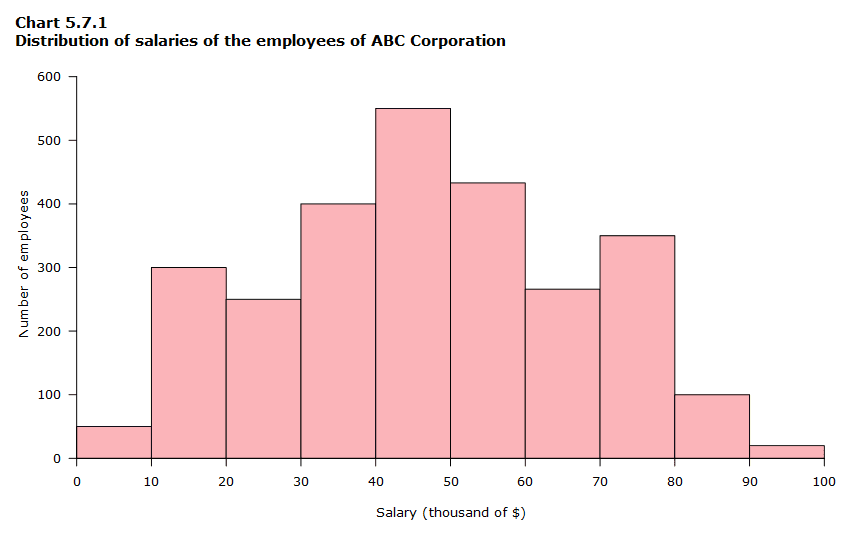
Calculate the mean of the following (round to nearest decimal)
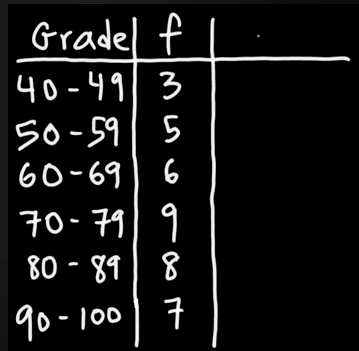
In which interval can the median be found?

What is the modal class?
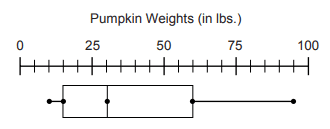
According to the box-and-whisker plot, what was the median weight of a pumpkin at the annual pumpkin festival?
Each student’s score on the final exam in Mr. Shenton’s class is listed below.58, 72, 74, 92, 84, 40, 74, 81, 76, 83, 60
What was the lower quartile score on Mr. Shenton’s final exam?
Drawing box-and-whisker-plots

Calculate the variance of the following population’s dataset: {2, 4, 4, 6}
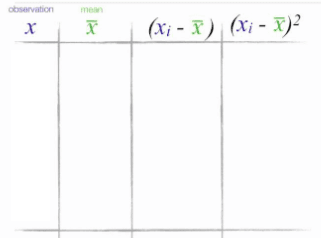
Calculate the standard deviation of the following population’s dataset: {2, 4, 4, 6}
If the variance of the data is 2, calculate the coefficient of variation % of the following dataset: {2, 4, 4, 6}
The relationship between mean, median and mode is as follows:
2 Mean = 3 Median – Mode
(Note: You need to memorize the formula for the exam.)
The mean of a dataset is 10, the median is 8. What is the mode?
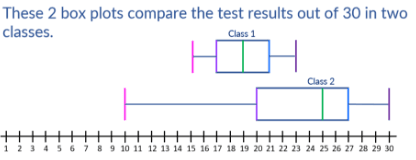
Fill in the missing word:
"The _____________ score for class 2 is higher than the _______________ of class 1."
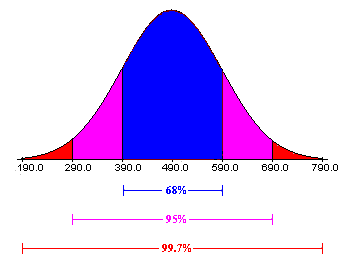
Between which two numbers can we find 95.5% of the data in a data set?
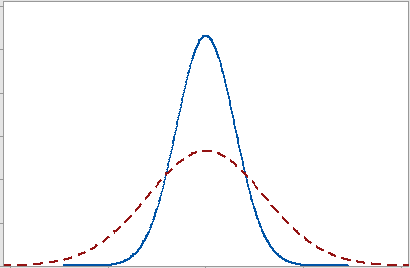
Which graph has the greatest standard deviation?
Note: In the exam you will be asked to explain what this means...