Compare histograms with the same data represented in stem-and-leaf plots, line plots, and circle graphs.
Track each student's skills and progress in your Mastery dashboards
Give this quiz to my class
Q 1/5
Score 0
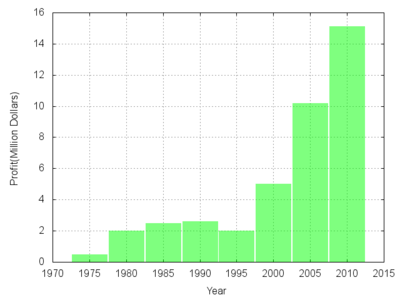
What represents frequency in this histogram?
120
Year
Height of the bars
Profit
Q 2/5
Score 0
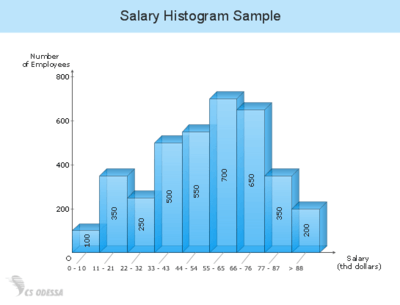
How many employees are there that make between $33,000 and $43,000
120
500
750
550
250
5 questions
Q.
What represents frequency in this histogram?
1
120 sec
7.9.a
Q.
How many employees are there that make between $33,000 and $43,000
2
120 sec
7.9.a
Q.
A florist recorded the number and cost of flower bouquets that were sold daily and recorded the data below. What is the frequency of a bouquet that cost at least $40?
3
120 sec
7.9.a
Q.
Ms. Long tracked the number and age of students that visited the library per month and recorded the data below. Where would the median fall?