

Feel free to use or edit a copy
includes Teacher and Student dashboards
Measures 2 skills from
Measures 2 skills from
With a free account, teachers can
- edit the questions
- save a copy for later
- start a class game
- automatically assign follow-up activities based on students’ scores
- assign as homework
- share a link with colleagues
- print as a bubble sheet
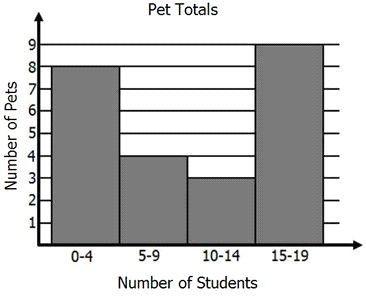
- Q 1/5Score 0Which interval shows the greatest number of pets?290-45-910-1415-19


5 questions
Show answers
- Q1Which interval shows the greatest number of pets?0-45-910-1415-19120s7.9.b
- Q2The height of all the students in Ms. Long's class are recorded in the table. Where would the median fall?60-6550-5445-4955-59120s7.9.b
- Q3The amount of items that each student sold for the class fundraiser was recorded. What percent of students sold at most 44 items?30%35%65%50%120s7.9.b
- Q4Which type of graph displays data in consecutive and equivalent intervals?Circle GraphHistogramLine PlotStem-and-Leaf Plot120s7.9.c
- Q5Mr. Semo is making a histogram to show the scores on the last science test. He first lists the scores in a stem-and-leaf plot. How many units tall should the bar be for the interval 70-79?51192120s7.9.c


