Construct and interpret scatter plots for bivariate measurement data to investigate patterns of association between two quantities. Describe patterns such as clustering, outliers, positive or negative association, linear association, and nonlinear association.
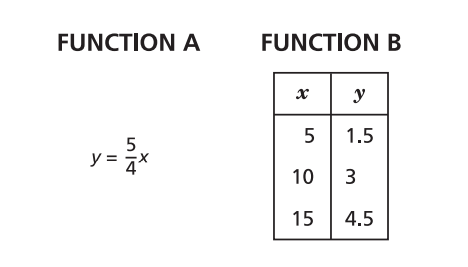
Graph proportional relationships, interpreting the unit rate as the slope of the graph. Compare two different proportional relationships represented in different ways.
Apply the Pythagorean Theorem to find the distance between two points in a coordinate system.
Know and apply the properties of integer exponents to generate equivalent numerical expressions.
Understand that a two-dimensional figure is congruent to another if the second can be obtained from the first by a sequence of rotations, reflections, and translations. Given two congruent figures, describe a sequence that exhibits the congruence between them.
Use similar triangles to explain why the slope m is the same between any two distinct points on a non-vertical line in the coordinate plane; derive the equation y = mx for a line through the origin and the equation y = mx + b for a line intercepting the vertical axis at b.
Use the equation of a linear model to solve problems in the context of bivariate measurement data, interpreting the slope and intercept.
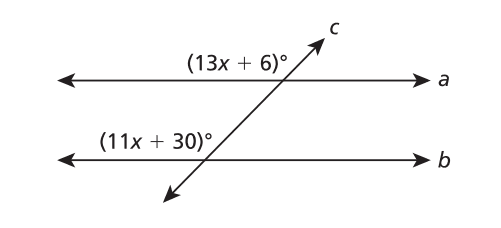
Use informal arguments to establish facts about the angle sum and exterior angle of triangles, about the angles created when parallel lines are cut by a transversal, and the angle-angle criterion for similarity of triangles.
Know that a two-dimensional figure is similar to another if the corresponding angles are congruent and the corresponding sides are in proportion. Equivalently, two two-dimensional figures are similar if one is the image of the other after a sequence of rotations, reflections, translations, and dilations. Given two similar two-dimensional figures, describe a sequence that maps the similarity between them on the coordinate plane.
Understand informally that every number has a decimal expansion; for rational numbers show that the decimal expansion eventually repeats. Know that other numbers that are not rational are called irrational.
Describe the effect of dilations, translations, rotations, and reflections on two-dimensional figures using coordinates.
Know and apply the properties of integer exponents to generate equivalent numerical expressions.
Given the formulas for the volume of cones, cylinders, and spheres, solve mathematical and real- world problems.
Understand that a function is a rule that assigns to each input exactly one output. The graph of a function is the set of ordered pairs consisting of an input and the corresponding output.
Construct a function to model a linear relationship between two quantities. Determine the rate of change and initial value of the function from a description of a relationship or from two (x, y) values, including reading these from a table or from a graph. Interpret the rate of change and initial value of a linear function in terms of the situation it models, and in terms of its graph or a table of values.
Perform multiplication and division with numbers expressed in scientific notation, including problems where both standard decimal form and scientific notation are used. Use scientific notation and choose units of appropriate size for measurements of very large or very small quantities. Interpret scientific notation that has been generated by technology.
Solve systems of two linear equations in two variables with integer coefficients: graphically, numerically using a table, and algebraically. Solve simple cases by inspection.
Use informal arguments to establish facts about the angle sum and exterior angle of triangles, about the angles created when parallel lines are cut by a transversal, and the angle-angle criterion for similarity of triangles.
Track each student's skills and progress in your Mastery dashboards