Loading...
Mathematics in the Modern World
Quiz by Maria Vanessa Galleposo Sagario
Customize this quiz to suit your class
Instantly translate to 100+ languages
Tag the questions with any skills you have. Your dashboard will track each student's mastery of each skill.
Give this quiz to my class
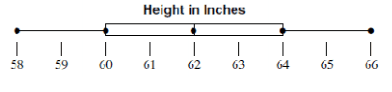
What is the maximum value?
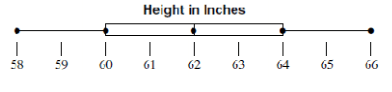
66
58
60
64
What data value is the upper quartile (Q3)?
66
62
58
64
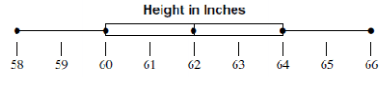
What is the maximum value?
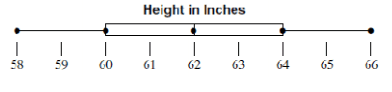
What data value is the upper quartile (Q3)?
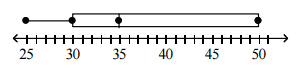
What percent of the data is between 25 and 30 on the number line?

What percentage of the data is between 90 and 140?

What is the interquartile range (IQR) of the data set?
Ervin bowled 7 games last weekend. His scores are: 155, 165, 138, 172, 127, 193, 142. What is the range of Ervin's scores?
Find the mean of these numbers:2, 57, 38, 42, 6
What percentage of the data is between 40 and 150?

Which of the following best describes the process of finding the range for a set of data?
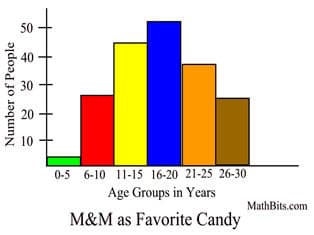
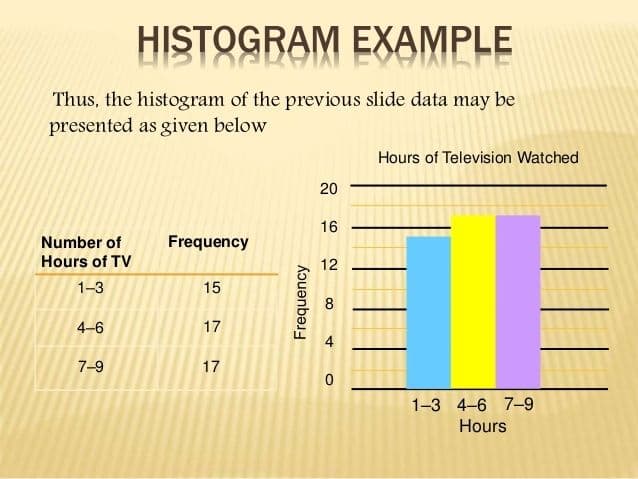
What type of graph is this?
How many people watched more than 6 hours of TV?
Which interval has the greatest number of students?
What is the range of the following set of data?15, 25, 33, 33, 42, 47
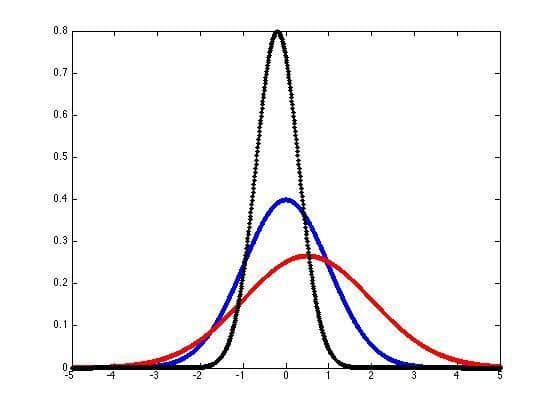
Which curve has the greater standard deviation?
Adam's Z-score on a test is +2.5. What does this mean?
Joanne's Z-score is -1.5. What does this mean?
What is the standard deviation for the data given:
5, 10, 7, 12, 0, 20, 15, 22, 8, 2
What is measures of dispersion?
This is used to make estimates or inferences about the population standard deviation.
Standard deviation is a measure of theamount of variation or dispersion of a set ofvalues. A ______ standard deviation indicatesthat the values tend to be close to the meanof the set, while a high standard deviationindicates that the values are spread outover a wider range.