Mean, Median, Mode, Range & Circle Graphs
Quiz by Alicia Carr
Grade 6
Mathematics
Virginia Standards of Learning
Feel free to use or edit a copy
includes Teacher and Student dashboards
Measures 3 skills from
With a free account, teachers can
- edit the questions
- save a copy for later
- start a class game
- automatically assign follow-up activities based on students’ scores
- assign as homework
- share a link with colleagues
- print as a bubble sheet
6 questions
Show answers
- Q1The mean is also referred to as the...minimumrangeaveragemaximum30s6.11
- Q2What is the formula for calculating the mean?sum of data points minus number of data pointssum of data points divided by number of data pointssum of data points multiplied by number of data pointssum of data points plus number of data points30s6.11.a
- Q3What is the mean of the data set: 3, 5, 2, 7, 4?4.84.24.44.030s6.11
- Q4If a data set has an even number of data points, how is the mean calculated?the sum of all data pointsthe median valuethe average of the two middle valuesthe mode value30s6.11.a
- Q5
John's test scores are listed below.
0, 75, 80, 90, 90
If he drops the lowest score, which statement below is FALSE?
The median will increase
The mode will remain the same
The mean will remain the same
The range will decrease
30s6.11.b - Q6
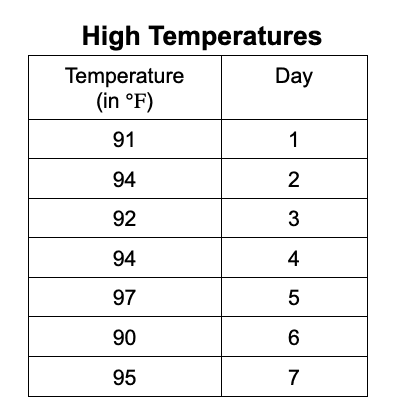
Izzy recorded the high temperature in her town each day for 7 days.
If she records a temperature of 930F on day 8, which statement about her data would be correct?
The median will increase.
The mode will increase.
The mode will decrease.
The median will decrease.
30s6.11.b