placeholder image to represent content

Mod 49 MCQ Quiz

Quiz by Hannah Tapp Thomas

Our brand new solo games combine with your quiz, on the same screen

Correct quiz answers unlock more play!

New Quizalize solo game modes
14 questions
Show answers
  • Q1

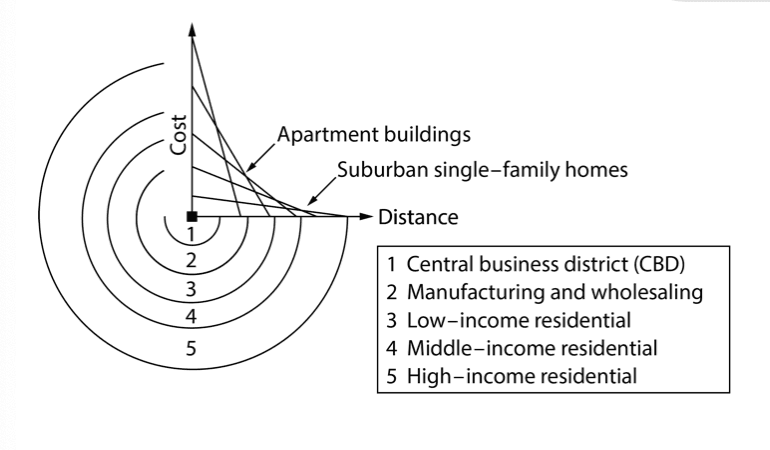
    The following graph BEST supports which model/thoery in urbanization related to cities in the U.S.? 

    Question Image

    bid-rent theory 

    concentric zone model

    central place theory

    sector model

    galactic city model 

    120s
  • Q2

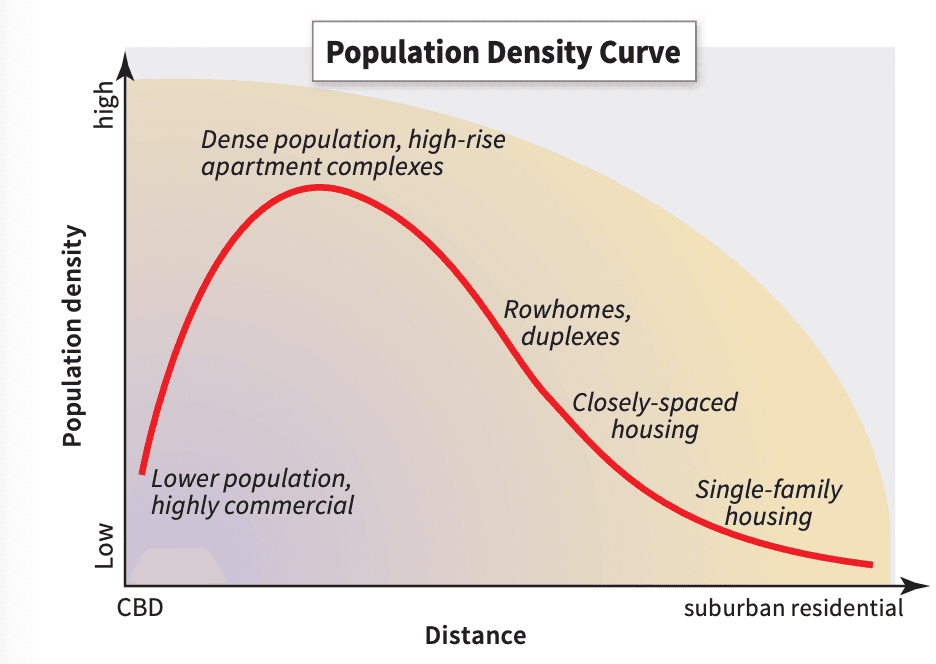
    Which statement BEST reflects the relationship between residential density and land value? 

    Land value increases as one moves away from the CBD, evidenced by larger homes in the suburbs. 

    Residential density decreases as one moves away from the CBD because housing prices increase. 

    Residential density is highest in the suburbs because of more space and the perception of better schools.

    Land value is the highest in the CBD, forcing residential density to increase to share the cost of living in the CBD.

    Residential density is lowest in the suburbs because the CBD focuses on commercial rather than residential properties.

    300s
  • Q3

    The process of suburbanization was halted between 2007 and 2013 as a result of what phenomenon?

    Land prices decreased in the core areas. 

    Commercial opportunities spurred development in core areas. 

    Industrial expansion meant more pollution in suburban areas. 

    Commercial development decreased, meaning fewer shopping opportunities. 

    Residential financing decreased as a result of a banking crisis. 

    120s
  • Q4

    In the development of urban land, which of the following is typically built on the most accessible sites? 

    single-family housing

    farm markets

    retail complexes

    industrial parks 

    high-rise apartment buildings 

    120s
  • Q5

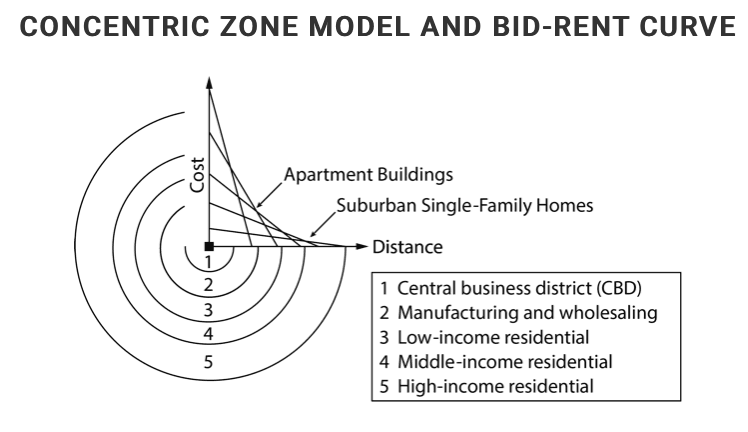
    Based on a comparison of the zones in the model shown, which of the following best explains how the model is limited in its representation of present-day urban land-use patterns? 

    Question Image

    The model does not account for the prices of agricultural land on the urban periphery, where land prices continue to decline.

    The model does not show that taller buildings constructed in the central business district are a result of increased land costs.

    The model does not indicate that land for apartment buildings is more expensive than land for single-family homes.

    The model does not account for the existence of suburbs composed of single-family homes where the housing structure is more expensive than the land it is built on.

    The model does not show the cost-to-distance effects of multiple suburban central business districts and the pattern of residential areas that surround them.

    300s
  • Q6

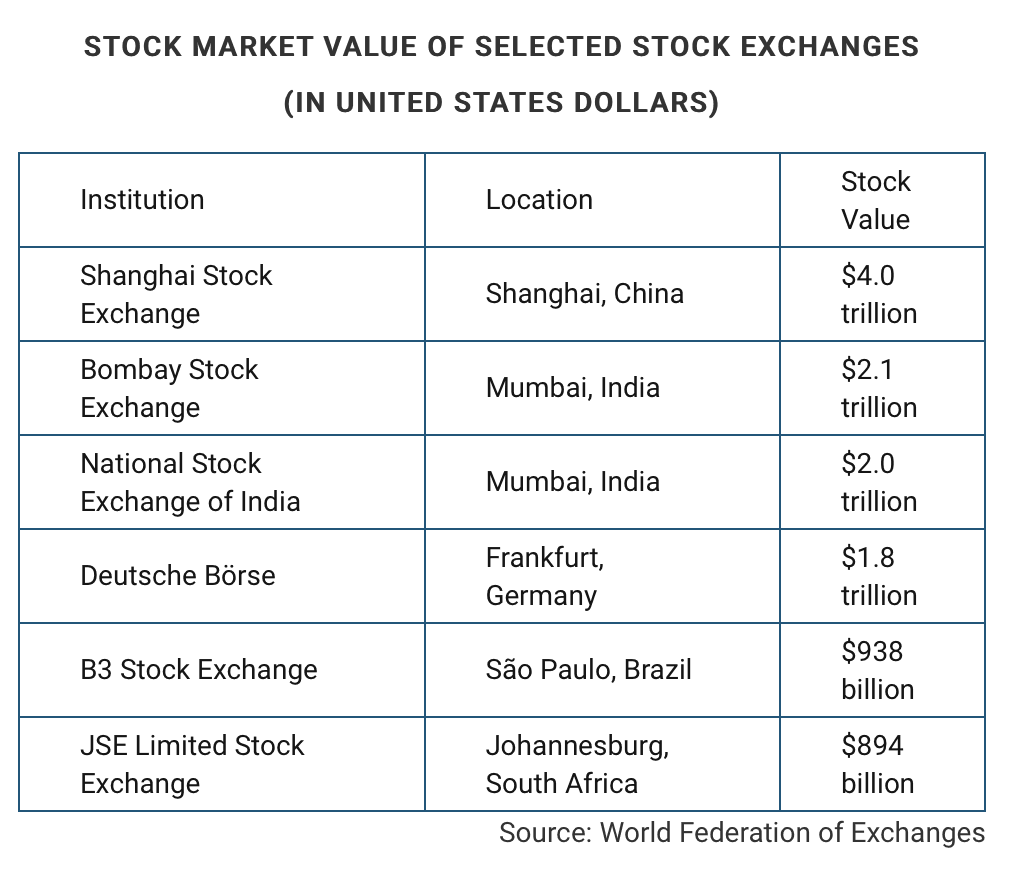
    Which of the following explains the importance of stock exchanges in the cities of Mumbai, India and Shanghai, China? 

    Question Image

    These cities have a large manufacturing labor force. 

    These cities function as global economic centers in the core. 

    These cities function as global economic centers in the semiperiphery. 

    These edge cities have al large number of high-technology companies. 

    These edge cities are built at the intersection of transportation routes. 

    300s
  • Q7

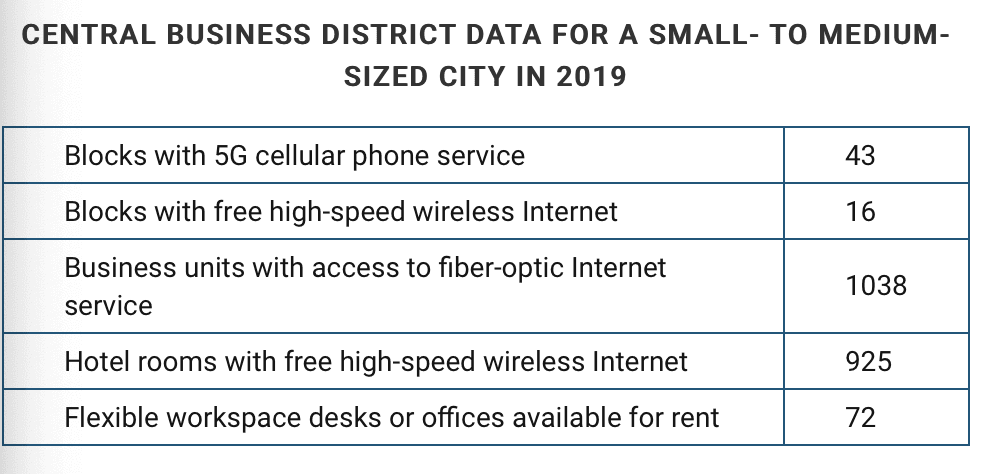
    Which of the following best explains what the central business district data indicate? 

    Question Image

    Business owners want to have fast Internet available for their consumers in order to improve online ratings for local services and generate return customers.

    Consumers demand that the fastest Internet service available before they will consider visiting a city or selecting a hotel for work or business trips.

    Politicians and activists have made Internet connectivity a basic right of urban residents and feel that governments should provide services to increase the connectivity of citizens.

    Government policy makers and business partners have focused infrastructure efforts on creating a downtown work environment that is positive for economic development.

    Communications companies expect that increasing Internet speeds will lead to increased number of subscribers to their networks.

    300s
  • Q8

    Which of the following describes the connection between land values and population density?

    I. Higher population density indicates a higher demand for land and thus the price of land is bid up in densely settled regions.

    II. Higher prices make land less affordable so that expensive locations generally have lower population densities.

    III. Larger areas of land will cost more but will be less likely to be densely settled.

    I only

    II only

    III only

    I and II

    II and III 

    300s
  • Q9

    In the contemporary pattern of migration to cities in more developed countries, migrants are more likely to settle in 

    suburban areas

    the central city

    Brownfield sites

    squatter settlements

    areas of gentrification 

    120s
  • Q10

    Which of the following statements explains the characteristics of cities in a postindustrial economy?

    The postindustrial city has new structures since the buildings of the industrial city cannot be reused.

    The postindustrial city has a large share of offices housing technology and information services.

    The postindustrial city has very few companies in the manufacturing sector.

    The postindustrial city is a high-density, compact city to facilitate information and technology businesses.

    The postindustrial city has few low-skill or general service jobs because of the demands of technology industries.

    120s
  • Q11

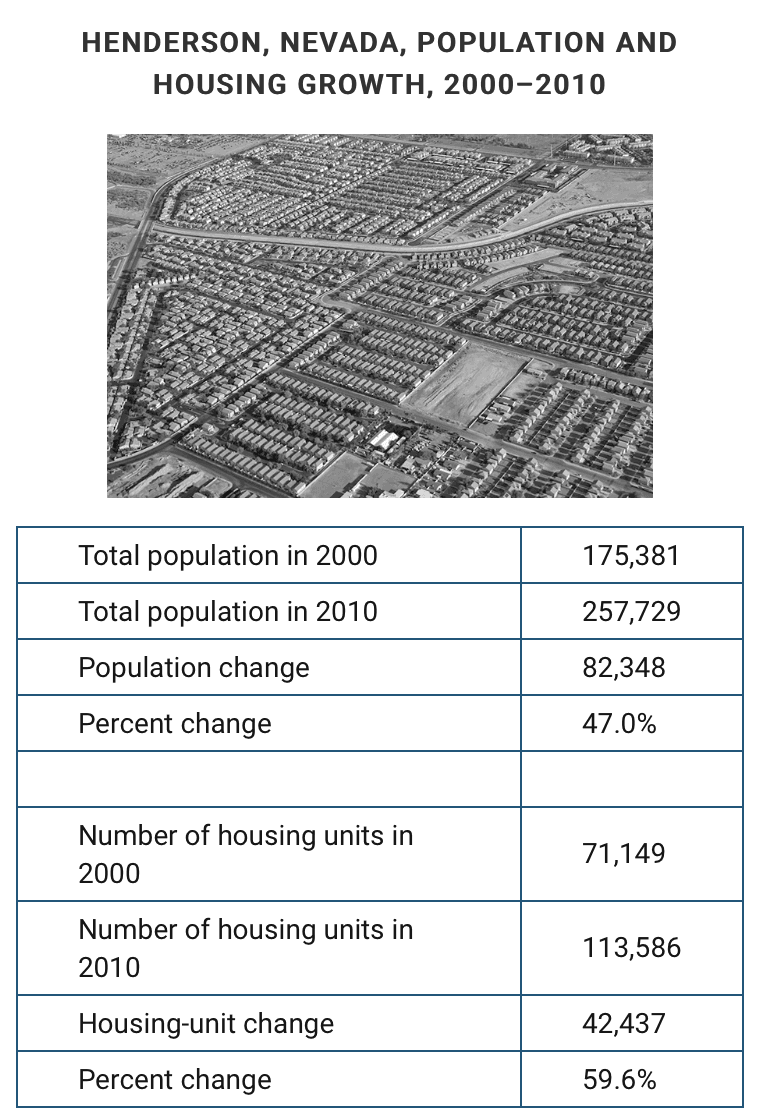
    The photograph above shows high-density residential housing built in the early 2000s in Henderson, Nevada, a suburb of Las Vegas, developed to accommodate large increases in population in the area. Which of the following best explains the growth in population and housing shown in the image and the census data?

    Question Image

    The growth brought on by resource extraction & industrialization. 

    The impacts deindustrialization in other Sun Belt region cities. 

    A period of immigration from Southern Europe & Eastern Europe. 

    A cycle of rapid economic development & real estate investment. 

    A phase of water-resource & hydroelectric-power development. 

    300s
  • Q12

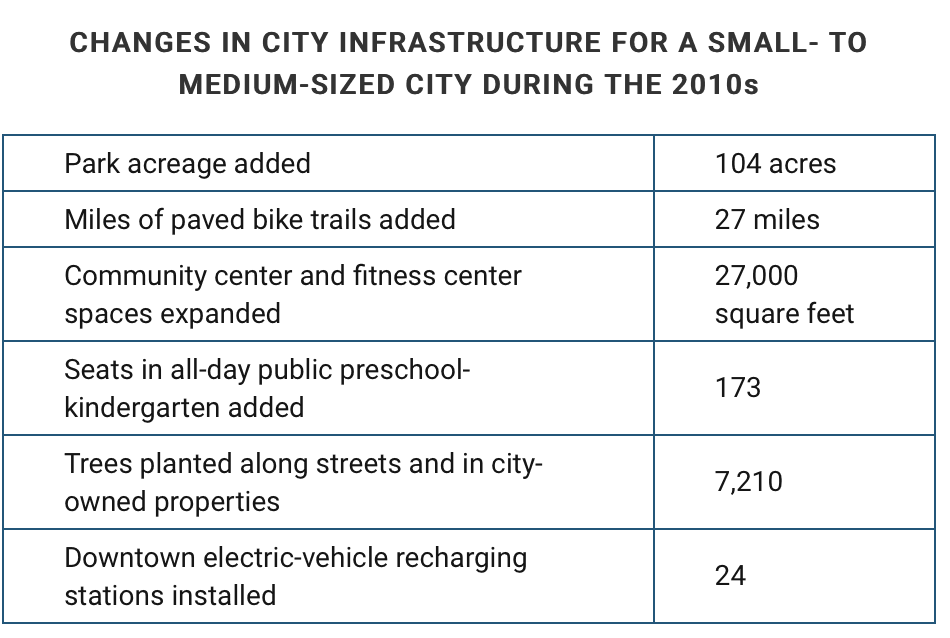
    Which of the following best explains the city planning trends shown in the data table? 

    Question Image

    Business development efforts have been made to increase the prices charged for commercial real estate.

    Transit-oriented development efforts have been made to decrease traffic and reduce the city's carbon footprint.

    Mixed-use development efforts have been made to increase the integration of residential and commercial land use.

    Economic development efforts have been made to improve benefits for employees working in the city.

    Social development efforts have been made to improve the quality of life for city residents.

    300s
  • Q13

    Which of the following statements explains the cost and distance relationship illustrated in the model in relation to the urban area’s residential patterns?

    Question Image

    Since land is more expensive in the suburbs, wealthier families build larger single-family homes in zone 5 in areas that provide amenities such as private schools for their children.

    Land is cheaper near the central business district (CBD), resulting in the construction of low-income apartments and giving low-income residents access to the amenities of the CBD.

    The lower cost of land farther from the CBD makes it affordable to build single-family homes in zones 4 and 5 for middle-income and high-income residents who desire to move into less crowded areas.

    People do not live in the CBD because of the traffic congestion, high cost of land, and lack of amenities such as museums and restaurants.

    Population density increases with the distance from the CBD as land prices decrease, allowing residents of all income levels to move farther away from zone 2.

    300s
  • Q14

    Which of the following most closely describes the leading trend in retailing in the United States during the 1950s, 1970s, and 1990s?

    Answer Image
    Answer Image
    Answer Image
    Answer Image
    Answer Image
    300s

Teachers give this quiz to your class