Tag the questions with any skills you have. Your dashboard will track each student's mastery of each skill.
Give this quiz to my class
Q 1/14
Score 0
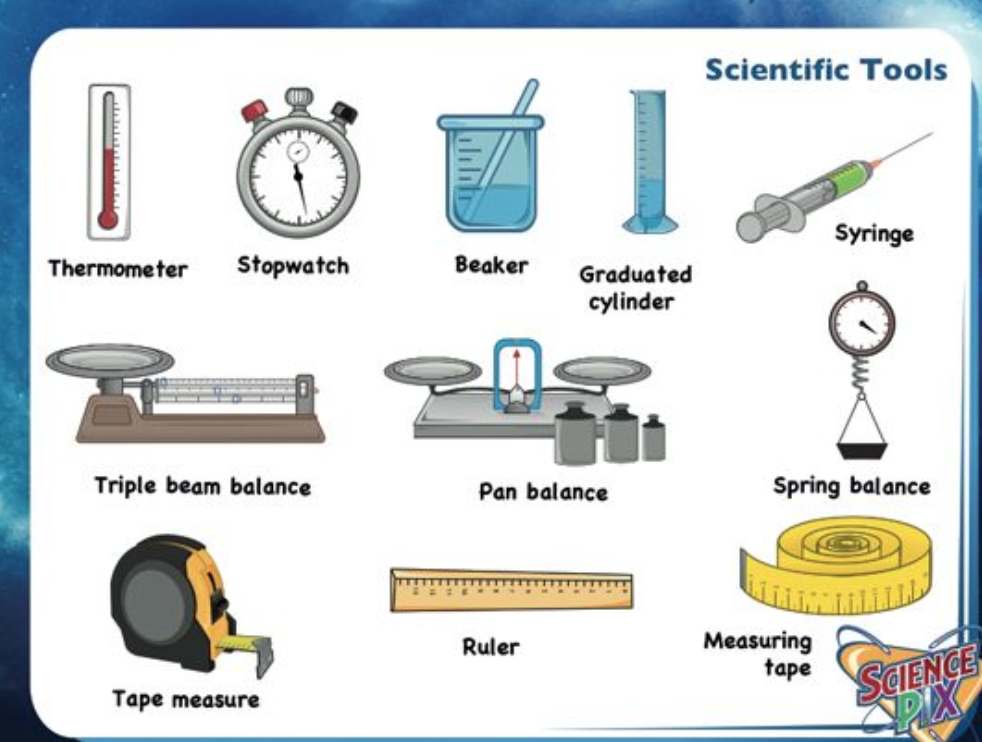
Students measure changes in weather temperature. Which tool is used when measuring this type of weather condition?
30
triple balance beam
all of the above
graduated cylinder
Celsius thermometer
Q 2/14
Score 0
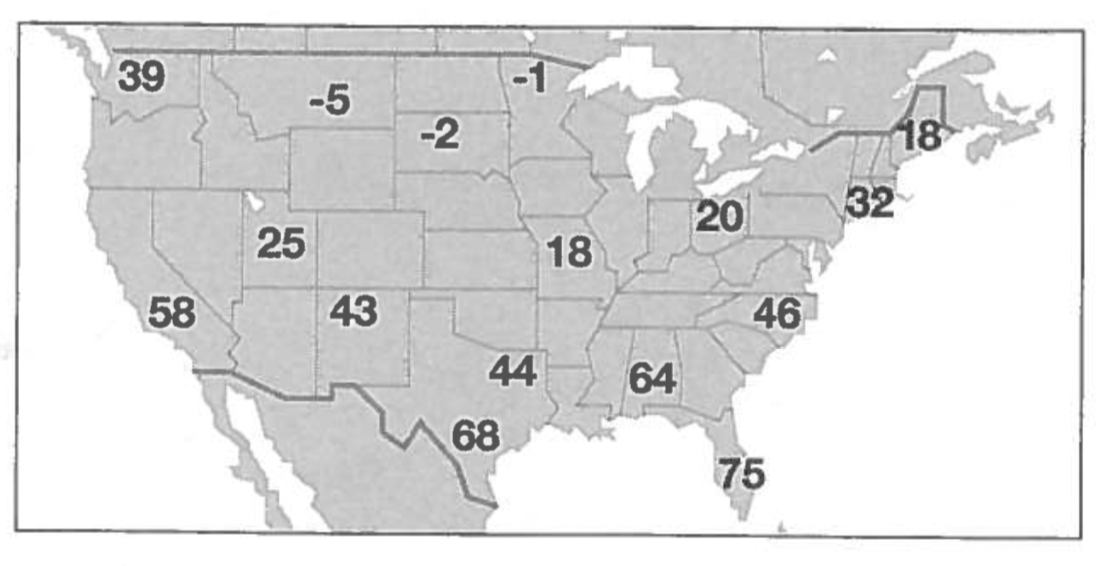
Pictured is a weather map of the United States. What do the numbers represent on the map?
30
temperature
wind speeds
precipitation
humidty
14 questions
Q.
Students measure changes in weather temperature. Which tool is used when measuring this type of weather condition?
1
30 sec
Q.
Pictured is a weather map of the United States. What do the numbers represent on the map?
2
30 sec
Q.
Students observe the local weather forecast in the newspaper and notice there is a change of rain expected in the area late that night. The students want to determine how much rain is received, so they use a tool in the science lab to measure the precipitation. What tool do the students use?
3
30 sec
Q.
A group of students cuts out the weather map from the newspaper. The weather forecast predicts a cold front will move through the area. Students mark the map with the appropriate weather symbol. Which symbol represents a cold front?
4
30 sec
Q.
Look at the areas that have the capital "L" symbol. What type of weather is usually associated with this symbol?
5
30 sec
Q.
Observe the weather map. What type of activity would be most appropriate for people living in the northern part of Oklahoma?
6
30 sec
Q.
A website records the average temperatures for June in Austin, Texas. Based on the information in the table which is the best prediction for the June temperatures in year 6?
7
45 sec
Q.
The ancient Greeks observed the clouds, wind, and rain to understand how they connected. Weather patterns, however, are very difficult to project. The term used by meteorologists for predicting the weather is
8
45 sec
Q.
Which of the following units of measurement is used when recording temperature?
9
45 sec
Q.
The map shows weather conditions for the United States. According to the weather map, which states are most likely experiencing sunny skies with little change of precipitation?
10
45 sec
Q.
Students measure the temperatures and record the changes over a 5 day period in science notebooks. Based on the information in the table, what prediction can be made regarding the low temperature on Friday?
11
30 sec
Q.
Based on the information in the table, what hypothesis can be made about the cause of the temperature change.
12
30 sec
Q.
What tool was most likely used to gather the data collected in the table?
13
30 sec
Q.
The diagram shows a mass of cold air colliding with a mass of warm air. Which of the following conditions is LEAST LIKELY to occur when a warm front and a cold front meet?