

Feel free to use or edit a copy
includes Teacher and Student dashboards
Measures 3 skills from
Measures 3 skills from
Track each student's skills and progress in your Mastery dashboards
With a free account, teachers can
- edit the questions
- save a copy for later
- start a class game
- automatically assign follow-up activities based on students’ scores
- assign as homework
- share a link with colleagues
- print as a bubble sheet
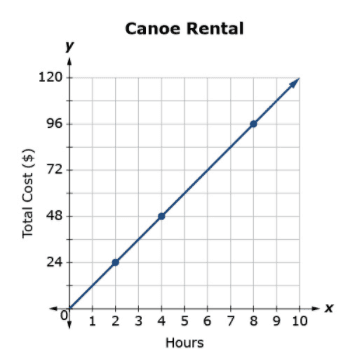
- Q 1/8Score 0Looking at this graph, which statement describes the relationship?29Non-proportionalProportional


8 questions
Show answers
- Q1Looking at this graph, which statement describes the relationship?Non-proportionalProportional300s7.4.A: Proportionality
- Q2If 4 tacos cost $3.80. What is the price per taco?$0.95$10.50$9.50$1.05300s7.4.B: Proportionality
- Q3A skydiver falls 144 ft in 3 seconds. How far does he fall in 1/2 a second?24 ft48 ft0.02 ft12 ft300s7.4.B: Proportionality
- Q4Which statement best describes this graph?Line B has the greatest slope.Line A has the greatest slope.Line C has the greatest slope.300s7.4.B: Proportionality
- Q5The graph represents the total number of cups of coffee and the total amount of sugar required to make the coffee. What is the constant of proportionality?00.20205300s7.4.C: Proportionality
- Q6Does this table represent a proportional or non-proportional relationship?Non-proportionalProportional300s7.4.A: Proportionality
- Q7The graph below shows the proportional relationship between the number of songs and hours. Let "s" represent the number of songs and "h" the number of hours. Which equation could be used to represent the relationship?h=0.13ss= 7.5hs=0.13 sh=7.5s300s
- Q8what is the equation to find the unit rate?x/yy/x300s


