Tag the questions with any skills you have. Your dashboard will track each student's mastery of each skill.
Give this quiz to my class
Q 1/15
Score 0
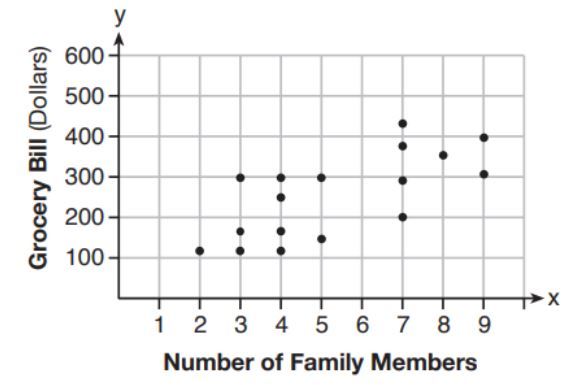
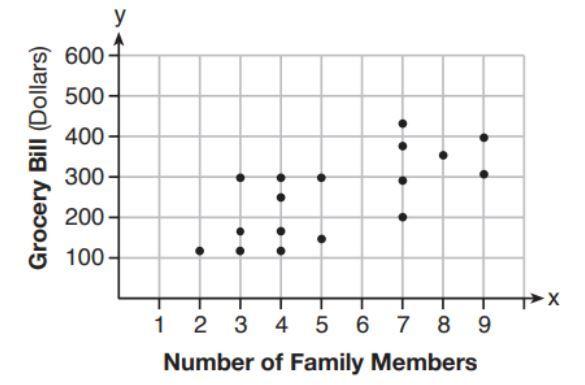
The scatter plot below shows the relationship between the number of members in a family and the amount of the family's weekly grocery bill. The most appropriate prediction of the grocery bill for a family that consists of six members is
30
350
500
200
400
Q 2/15
Score 0
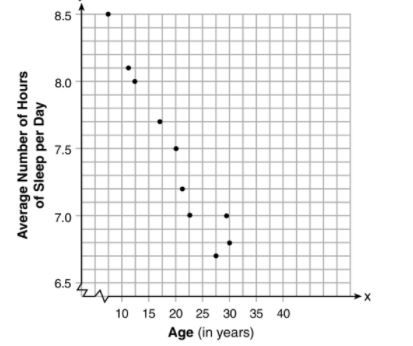
What is true about the graph?
30
30 year olds get the least amount of sleep.
The younger you are the less sleep you get.
The older you are the more sleep you get.
The older you are the less sleep you get.
15 questions
Q.
The scatter plot below shows the relationship between the number of members in a family and the amount of the family's weekly grocery bill. The most appropriate prediction of the grocery bill for a family that consists of six members is
1
30 sec
Q.
What is true about the graph?
2
30 sec
Q.
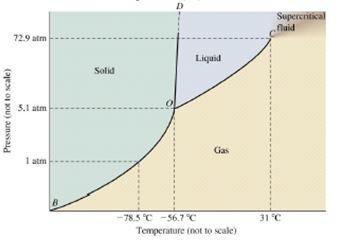
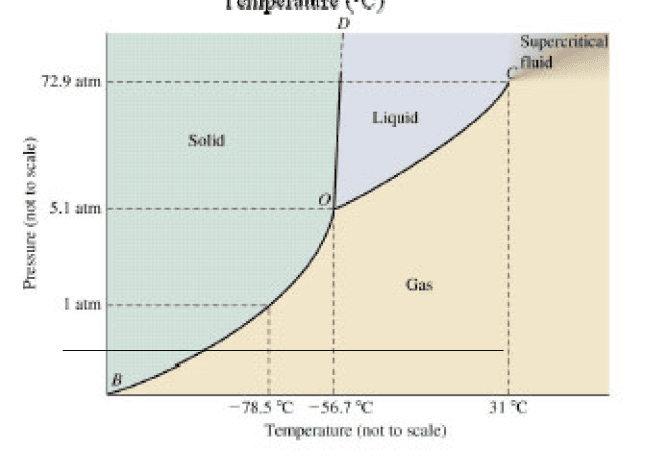
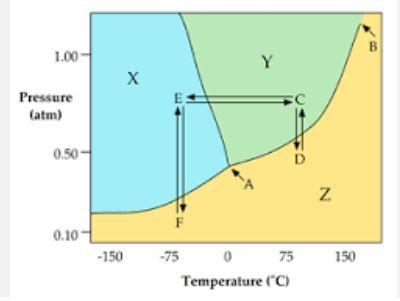
At 1 atmosphere and room temperature (25C), what phase is it in?
3
30 sec
Q.
At 1 atm and -78.5C what phase is the CO2 found in?
4
30 sec
Q.
What pressure would CO2 have to be at for it to be a liquid at 30C?
5
30 sec
Q.
Choose the graph that best fits with this statement: "House prices rose in January and February, fell slightly in March and are now holding steady "
6
30 sec
Q.
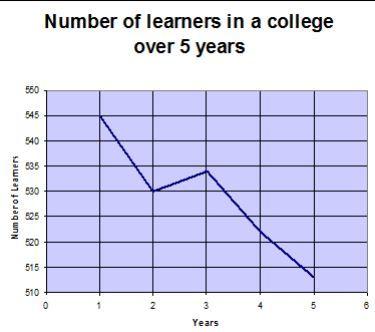
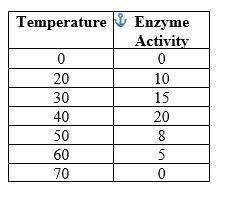
Which of these statements best describes what is shown in the graph?
7
30 sec
Q.
What would you expect the number of learners to be at 6 years?
8
30 sec
Q.
Click on the image to answer the question. As pressure increases what is true?