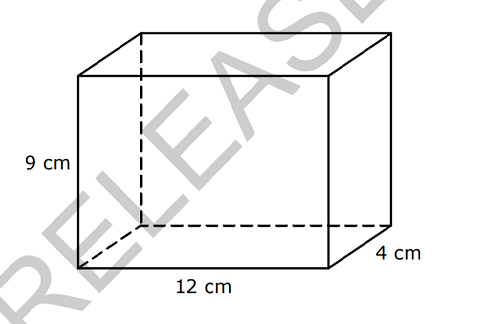
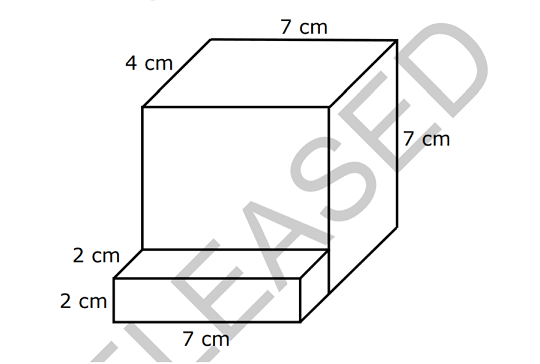
Relate volume to the operations of multiplication and addition. • Find the volume of a rectangular prism with whole-number side lengths by packing it with unit cubes, and show that the volume is the same as would be found by multiplying the edge lengths. • Build understanding of the volume formula for rectangular prisms with whole-number edge lengths in the context of solving problems. • Find volume of solid figures with one-digit dimensions composed of two non-overlapping rectangular prisms.
Represent and interpret data. • Collect data by asking a question that yields data that changes over time. • Make and interpret a representation of data using a line graph. • Determine whether a survey question will yield categorical or numerical data, or data that changes over time.
Track each student's skills and progress in your Mastery dashboards
Give this quiz to my class
Q 1/6
Score 0
60
Users enter free text
Q 2/6
Score 0
60
Users enter free text
6 questions
Q.
1
60 sec
NC.5.MD.5
Q.
2
60 sec
NC.5.MD.5
Q.
3
60 sec
NC.5.MD.1
Q.
4
60 sec
NC.5.MD.2
Q.
The line graph shows the monthly attendance at a fun park for a year.
Which statement describes the data on the line graph?