Display numerical data in plots on a number line. • Use dot plots, histograms, and box plots to represent data. • Compare the attributes of different representations of the same data.
Analyze center and variability by: o Giving quantitative measures of center, describing variability, and any overall pattern, and noting any striking deviations. o Justifying the appropriate choice of measures of center using the shape of the data distribution.
Determine the measure of center of a data set and understand that it is a single number that summarizes all the values of that data set. o Understand that a mean is a measure of center that represents a balance point or fair share of a data set and can be influenced by the presence of extreme values within the data set. o Understand the median as a measure of center that is the numerical middle of an ordered data set.
Track each student's skills and progress in your Mastery dashboards
Give this quiz to my class
Q 1/6
Score 0
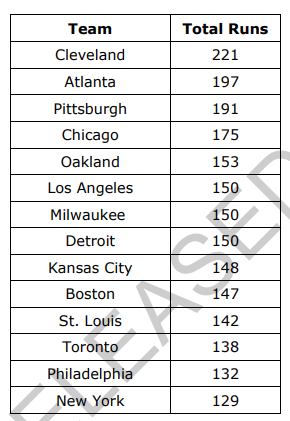
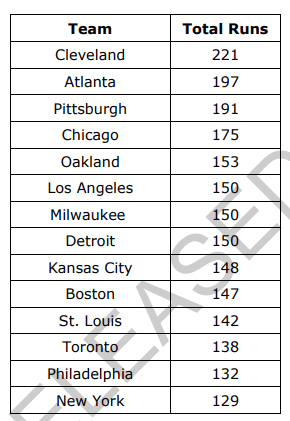
The table represents the number of runs scored by several baseball teams during a season.
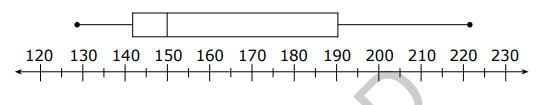
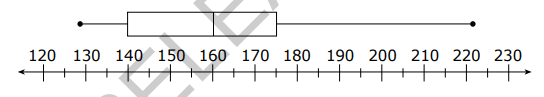
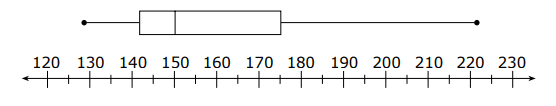
Which box plot correctly represents the data from the table?
(*NO CALCULATOR*)
60
Q 2/6
Score 0
Jamal scored 62, 75, 76, and 90 on four tests. What does he need to score on the fifth test in order to have a mean of exactly 80?
60
100
80
97
93
6 questions
Q.
The table represents the number of runs scored by several baseball teams during a season.
Which box plot correctly represents the data from the table?
(*NO CALCULATOR*)
1
60 sec
NC.6.SP.4
Q.
Jamal scored 62, 75, 76, and 90 on four tests. What does he need to score on the fifth test in order to have a mean of exactly 80?
2
60 sec
NC.6.SP.5.b
Q.
This table shows the number of minutes Carol and Anna walked each day for 5 days.
Which statement is true?
3
60 sec
NC.6.SP.3.a
Q.
The table shows the daily amount that Trevor spent on snacks.
During which week did Trevor spend a mean amount of $0.85 per day on snacks?
4
60 sec
NC.6.SP.3.a
Q.
A list of numbers is shown.
7, 14, 15, 9, 11, 14, 11, 10, 17
What is the mean of the list of numbers?
5
60 sec
NC.6.SP.5.b
Q.
A researcher was interested in how much Vitamin C adults had in their daily diets.
• The researcher surveyed 100 random adults.
• She made a box plot based on the amounts of Vitamin C in the diets of
the 100 adults.
What percent of those in the survey get at least 90 milligrams of Vitamin C?