Construct and interpret scatter plots for bivariate measurement data to investigate patterns of association between two quantities. Investigate and describe patterns such as clustering, outliers, positive or negative association, linear association, and nonlinear association.
Model the relationship between bivariate quantitative data to: • Informally fit a straight line for a scatter plot that suggests a linear association. • Informally assess the model fit by judging the closeness of the data points to the line.
Understand that patterns of association can also be seen in bivariate categorical data by displaying frequencies and relative frequencies in a two-way table. • Construct and interpret a two-way table summarizing data on two categorical variables collected from the same subjects. • Use relative frequencies calculated for rows or columns to describe possible association between the two variables.
Track each student's skills and progress in your Mastery dashboards
Give this quiz to my class
Q 1/7
Score 0
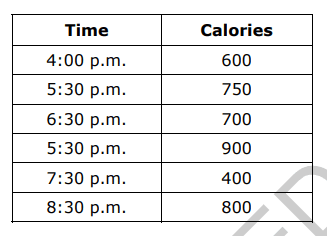
Susan recorded the time she ate dinner and the number of calories she consumed during dinner for six consecutive days. The results are shown in the table.
Which BEST describes the association between the time Susan ate dinner and the number of calories she consumed?
(*NO CALCULATOR*)
60
almost none
negative
positive
irrational
Q 2/7
Score 0
60
7 questions
Q.
Susan recorded the time she ate dinner and the number of calories she consumed during dinner for six consecutive days. The results are shown in the table.
Which BEST describes the association between the time Susan ate dinner and the number of calories she consumed?
(*NO CALCULATOR*)
1
60 sec
NC.8.SP.1
Q.
2
60 sec
NC.8.SP.3
Q.
3
60 sec
NC.8.SP.3
Q.
4
60 sec
NC.8.SP.2
Q.
The scatterplot shows the amount of sunlight some tomato plants received and the amount each plant grew.
What is the meaning of the slope of the trend line shown on the scatterplot?
5
60 sec
NC.8.SP.3
Q.
6
60 sec
NC.8.SP.4
Q.
Henry made the scatterplot shown.
The scatterplot shows the data points, and it also shows the linear model that Henry drew. Which statement BEST describes the linear model?