Draw a scaled picture graph and a scaled bar graph to represent a data set with several categories. Solve one- and two-step how many more and how many less problems using information presented in scaled bar graphs. For example, draw a bar graph in which each square in the bar graph might represent 5 pets.
Track each student's skills and progress in your Mastery dashboards
Loading...
Loading...
Loading...
Q 1/3
Score 0
60
Q 2/3
Score 0
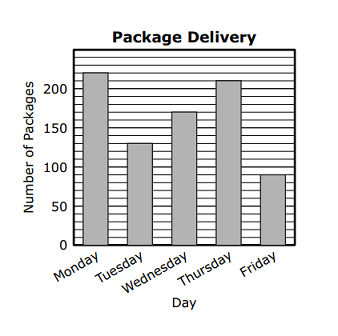
Mr. Conley delivers packages. The bar graph shows the total number of packages he delivered on five days last week.
How many more packages did Mr. Conley deliver on Monday and Tuesday than he did on Thursday and Friday?
Enter your answer in the box.
60
Users enter free text
3 questions
Q.
1
60 sec
3.MD.B.3
Q.
Mr. Conley delivers packages. The bar graph shows the total number of packages he delivered on five days last week.
How many more packages did Mr. Conley deliver on Monday and Tuesday than he did on Thursday and Friday?
Enter your answer in the box.
2
60 sec
3.MD.B.3
Q.
Jana gets a sticker for every 5 minutes she spends on her chores each day.
She puts them on a picture graph as shown.
Jana spends a total of 130 minutes doing chores during the week. How many stickers should Jana get on Friday?