Know that straight lines are widely used to model relationships between two quantitative variables. For scatter plots that suggest a linear association, informally fit a straight line, and informally assess the model fit (e.g. line of best fit) by judging the closeness of the data points to the line.
Track each student's skills and progress in your Mastery dashboards
Loading...
Loading...
Give this quiz to my class
Q 1/1
Score 0
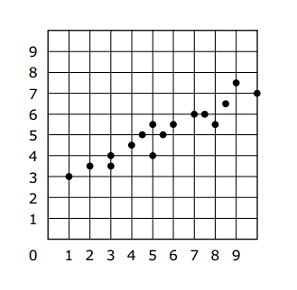
A scatter plot is shown on the coordinate plane.
Which of these MOST CLOSELY approximates a line of best fit for the data in the scatter plot?
60
1 question
Q.
A scatter plot is shown on the coordinate plane.
Which of these MOST CLOSELY approximates a line of best fit for the data in the scatter plot?