Use the mean and standard deviation of a data set to fit it to a normal distribution and to estimate population percentages. Recognize that there are data sets for which such a procedure is not appropriate. Use calculators, spreadsheets, and tables to estimate areas under the normal curve.
Fit a function to the data (including with the use of technology); use functions fitted to data to solve problems in the context of the data. Use given functions or choose a function suggested by the context. Emphasize linear and exponential models.
Track each student's skills and progress in your Mastery dashboards
Give this quiz to my class
Q 1/5
Score 0
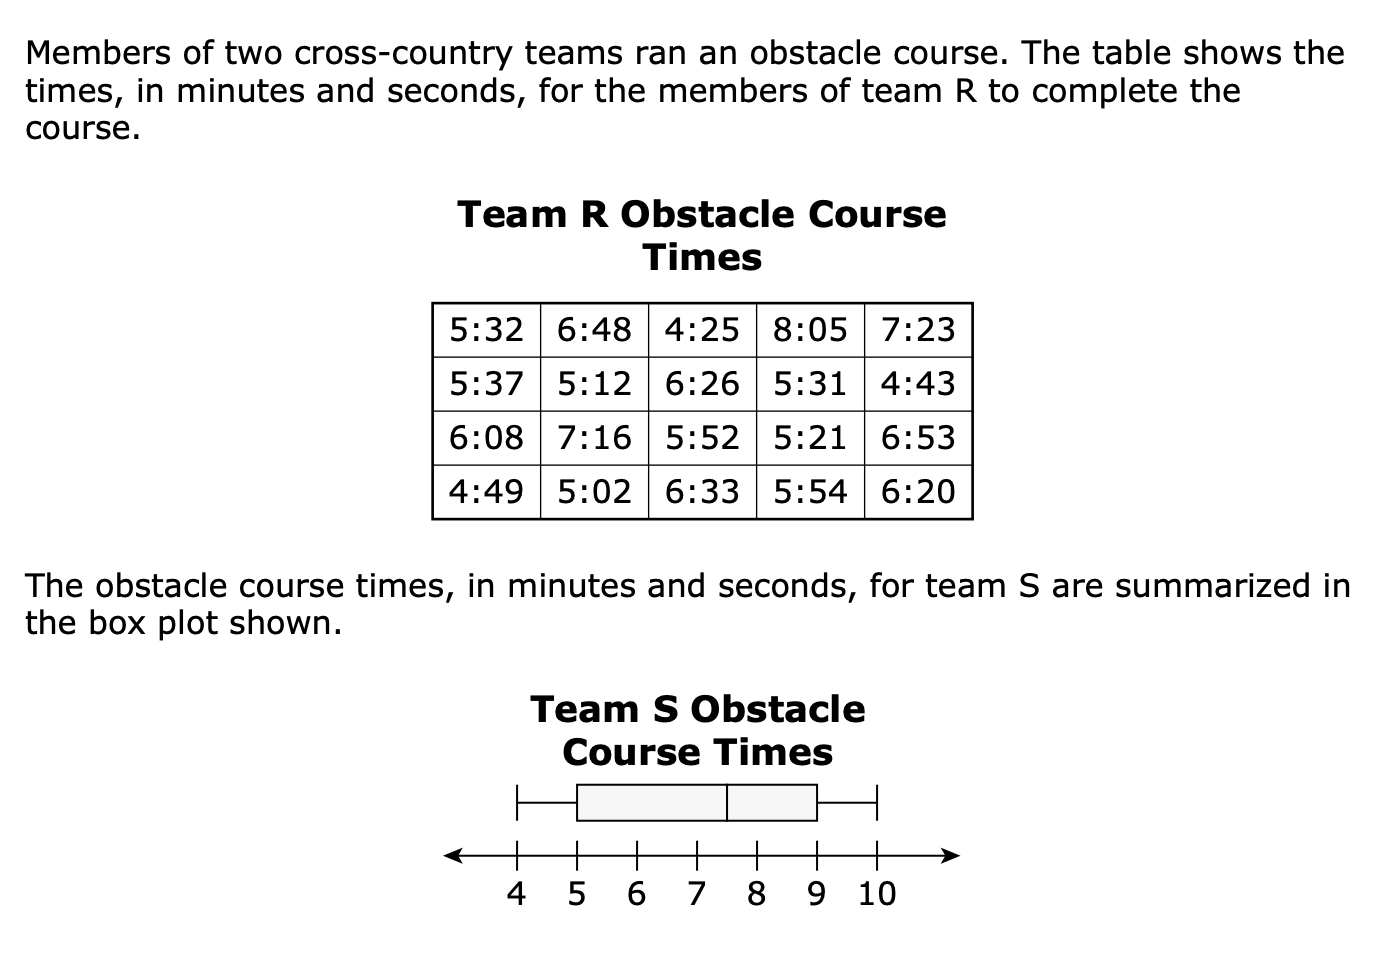
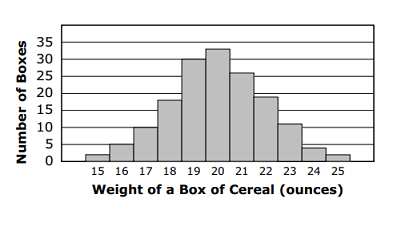
Which histogram represents the times from Team R on the obstacle course?
60
Q 2/5
Score 0
60
5 questions
Q.
Which histogram represents the times from Team R on the obstacle course?