Loading...

NY Released Test - Grade 7 Math (2024)(New York Standards)
Quiz by NYSED Math Grade 7
Track each student's skills and progress in your Mastery dashboards
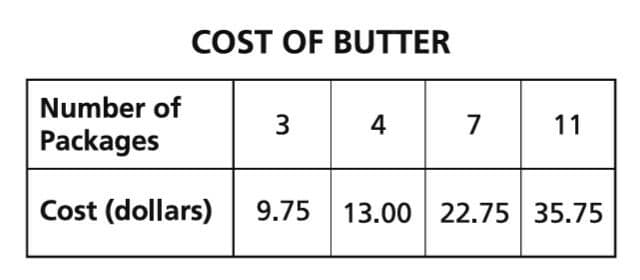
A store sells packages of butter. The table below shows the cost, in dollars, for different numbers of packages of butter.
What is the cost, per package, of the butter?

A store sells packages of butter. The table below shows the cost, in dollars, for different numbers of packages of butter.
What is the cost, per package, of the butter?
Mr. Moore collected data from his sixth grade class on how many minutes they studied for a test. The dot plot below shows the number of minutes each student studied.
Which statement about the distribution of the data is true?

A teacher records the test scores for the students in her class. The results are shown in the box plot below.
Based on these data, what is the interquartile range?


Which situation results in a final value of zero?

A store buys candy by the pound. The graph shown below represents the relationship between the weight, in pounds, and the total cost, in dollars, of the candy.
What is the cost of one pound of candy?
