NY State Testing Released Questions - Mathematics - Grade 7 (2018) - Topic: Statistics and Probability
Quiz by NY State Testing Released Questions - Mathematics - Grade 7 (2018)
Feel free to use or edit a copy
includes Teacher and Student dashboards
Measures 4 skills from
Measures 4 skills from
Track each student's skills and progress in your Mastery dashboards
With a free account, teachers can
- edit the questions
- save a copy for later
- start a class game
- automatically assign follow-up activities based on students’ scores
- assign as homework
- share a link with colleagues
- print as a bubble sheet
5 questions
Show answers
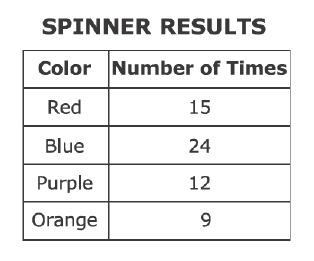
- Q160s7.SP.C.7.B
- Q2A principal gathered data about the distance, in miles, that his teachers and bus drivers live from the school. The box plots below show these data. Based on the box plots, which statement is true?The range of the distances for the teachers is twice the range of the distances for the bus drivers.The interquartile range of the distances for the bus drivers is twice the interquartile range of the distances for the teachers.The range of the distances for the teachers is 5 miles less than the range of the distances for the bus drivers.The interquartile range of the distances for the bus drivers is 5 miles less than the interquartile range of the distances for the teachers.60s7.SP.B.3
- Q3A spinner with seven equal-sized sections was used to play a game. • It was used 250 times in the first game. • Of those 250, the arrow landed on section 7 a total of 35 times. • The same spinner was used 150 times in the second game. How many times did the spinner 'most likely' land on section 7 in the second game?1430213560s7.SP.C.6
- Q4A computer program selects blue, red, or green as the background color each time the program is used. • The program was used 45 times on the same computer in one week. • Of those 45 times, a blue background appeared 12 times and a red background appeared 21 times. Based on this information, which statement about the likelihood of the green background appearing the next time the program is used is true?Green is just as likely as red or blue to appear.Green is just as likely as blue to appear, but not as likely as red.Green is not as likely as blue to appear, but is as likely as red.Green is not as likely as red or blue to appear.60s7.SP.C.7.B
- Q5Which number represents the probability of an event that is very likely to occur?0.890.090.121.360s7.SP.C.5
