Loading...
P 1 - first semester test
Quiz by FH Baradaran
Customize this quiz to suit your class
Instantly translate to 100+ languages
Tag the questions with any skills you have. Your dashboard will track each student's mastery of each skill.
Give this quiz to my class
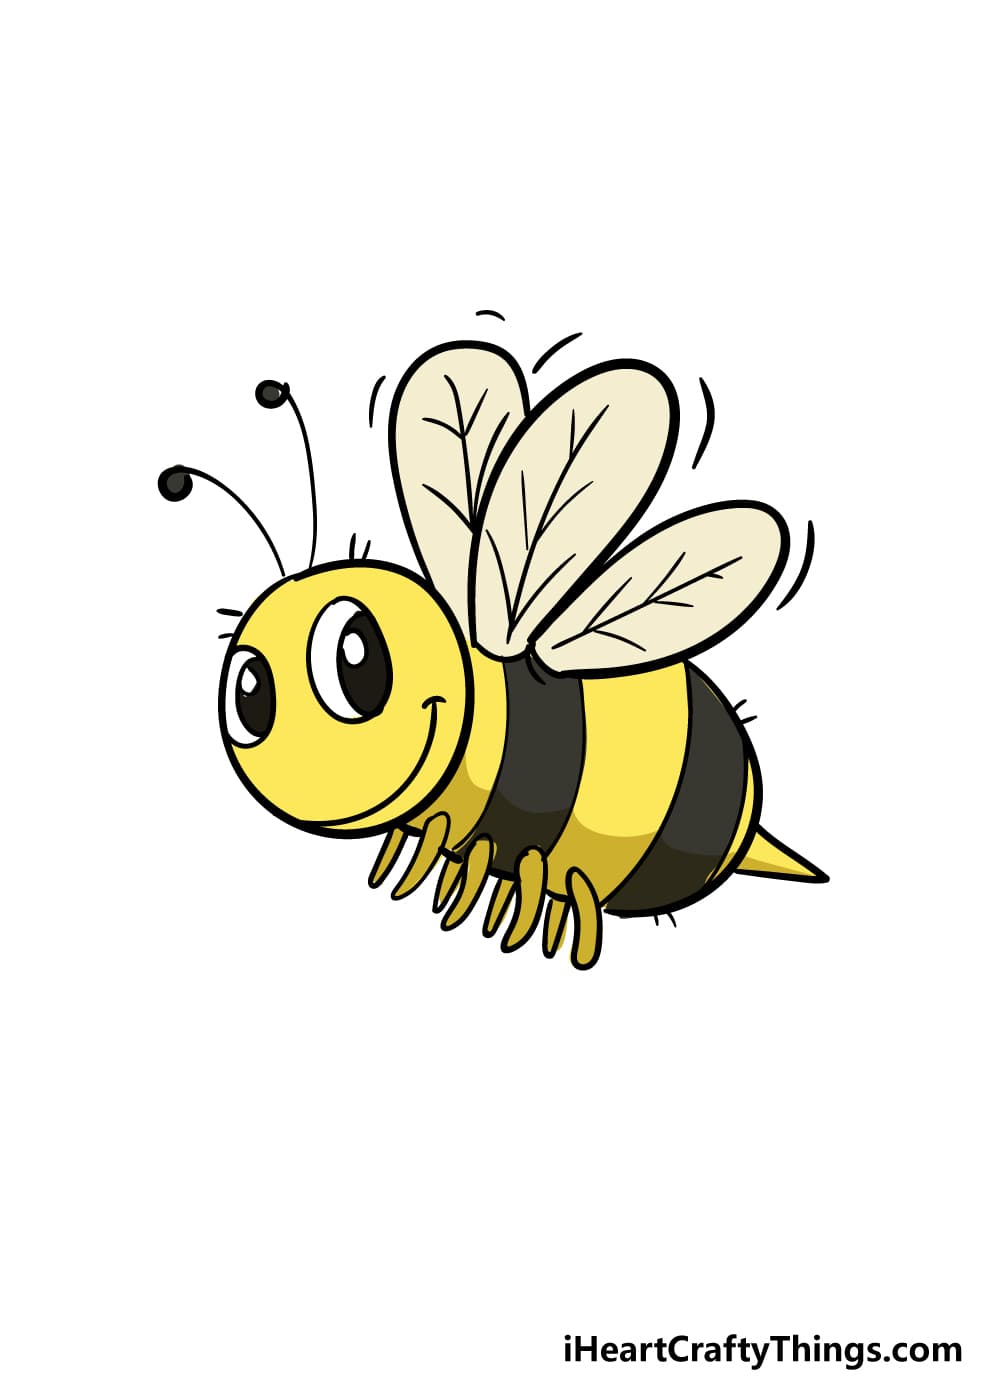
What is the name of this picture in Farsi?
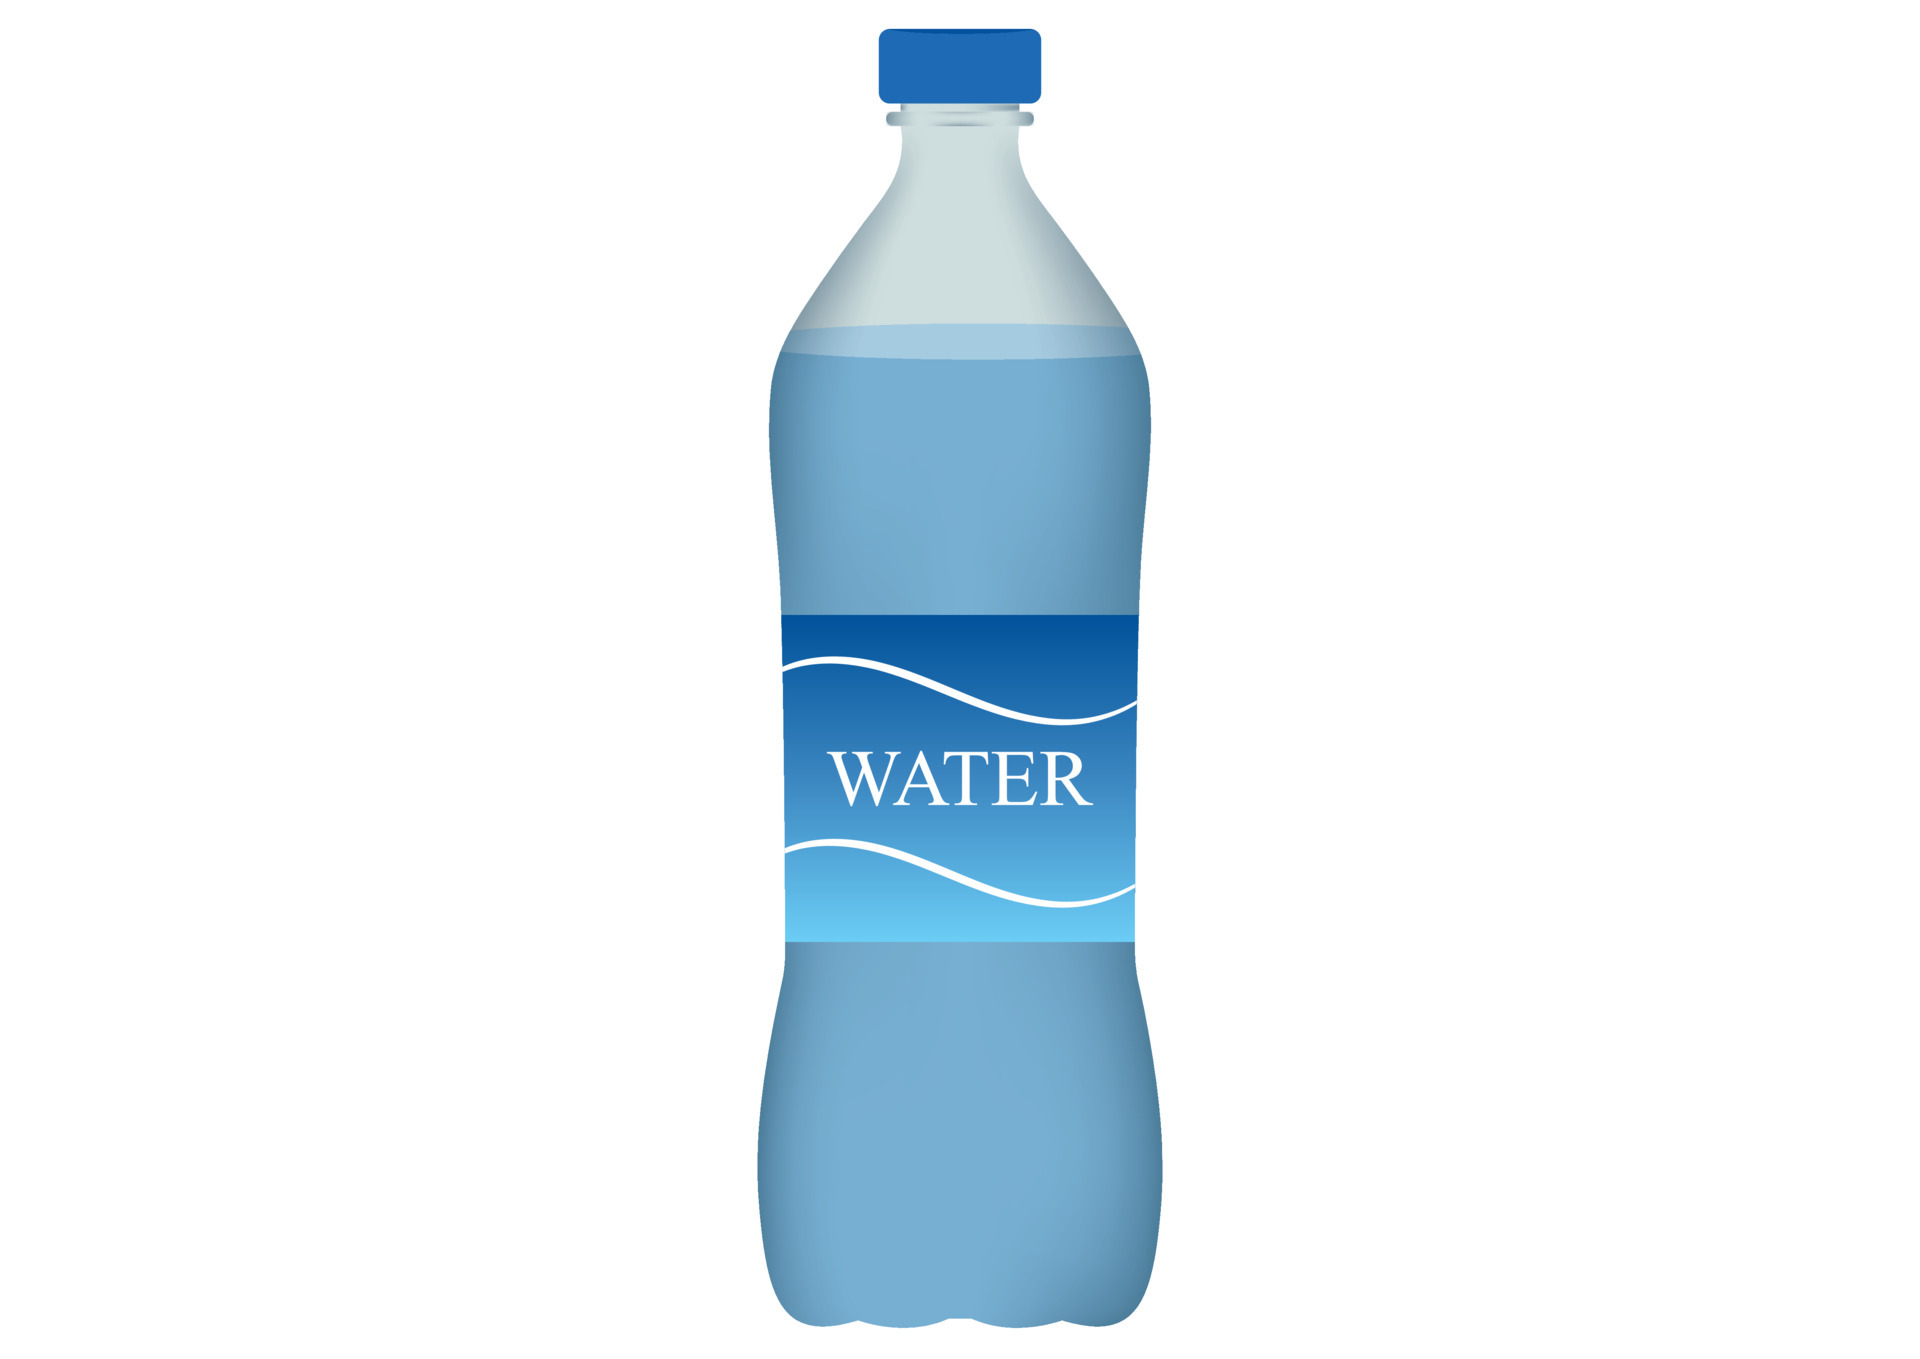
بابا
آب
مادرَ
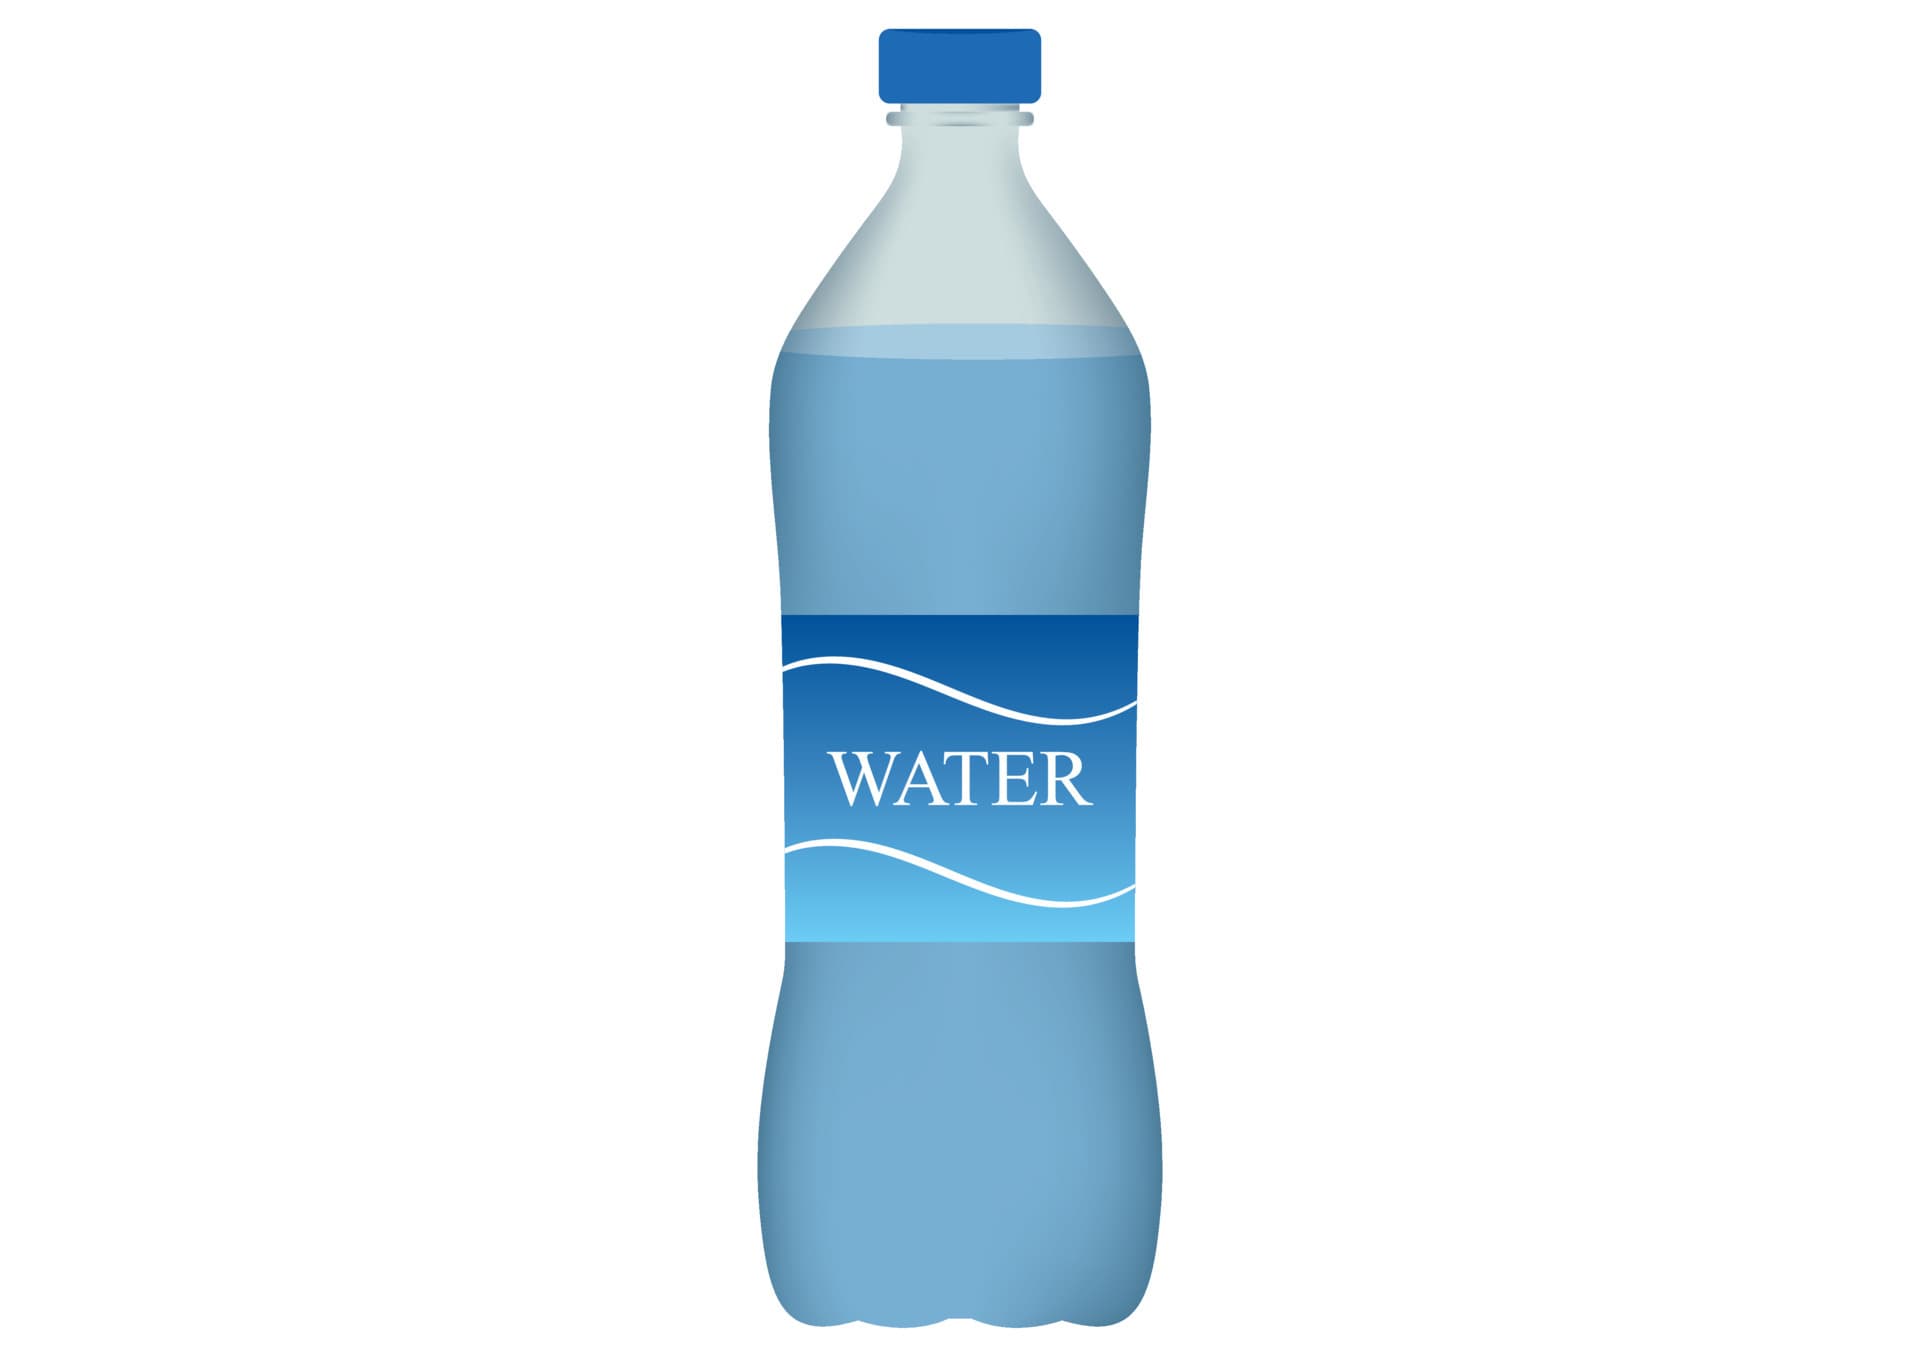
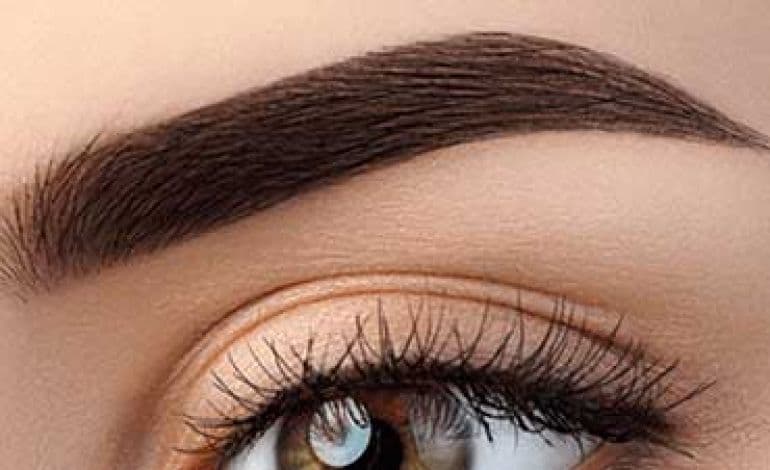
What is the name of this picture in Farsi?

بادام
اَنار
نان
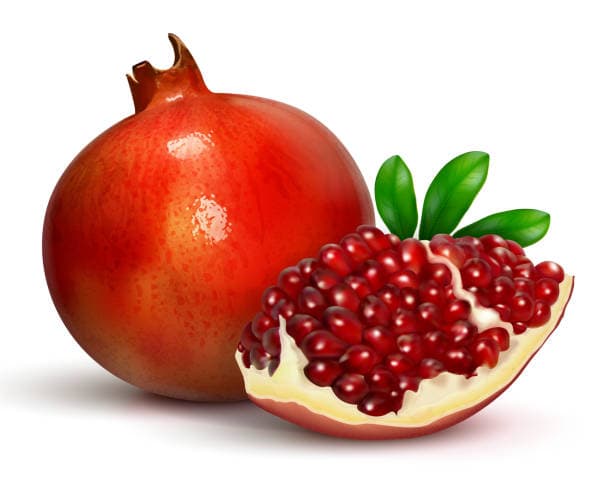
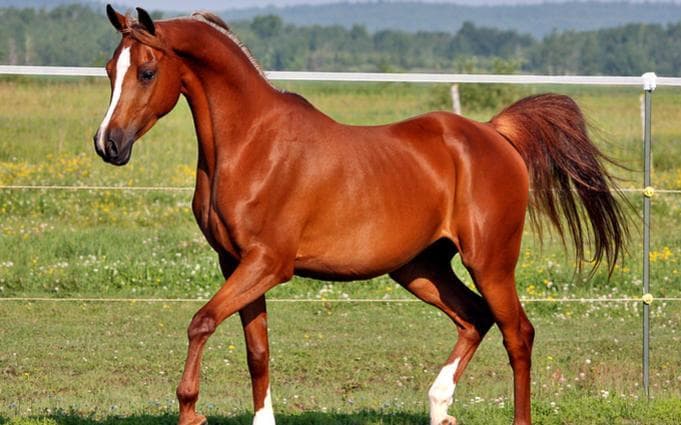
What is the name of this picture in Farsi?
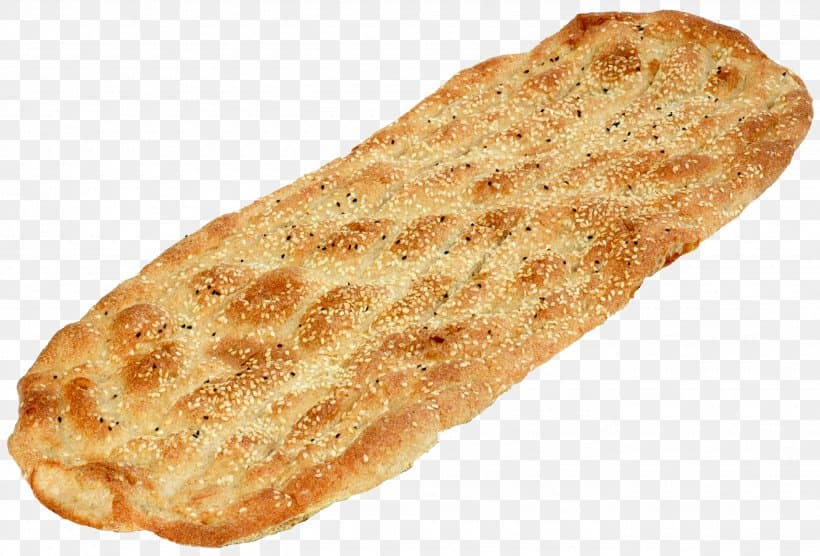
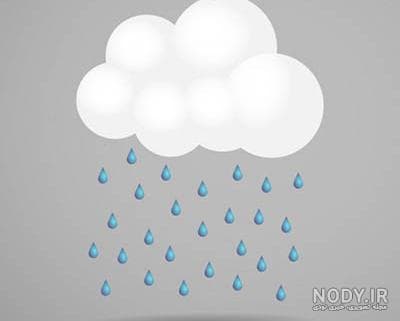
What is the name of this picture in Farsi?
What is the name of this picture in Farsi?

What is this in Farsi?
In Farsi?

؟
?

؟
؟
؟

؟
name
is?
؟