Generate and interpret graphs and charts describing different types of motion, including investigations using real-time technology such as motion detectors or photogates.
Track each student's skills and progress in your Mastery dashboards
Give this quiz to my class
Q 1/13
Score 0
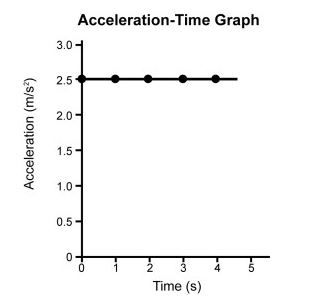
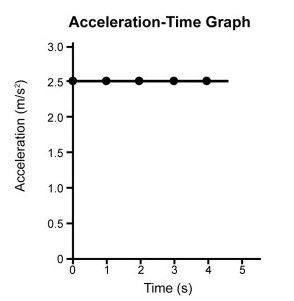
A ball is released from rest and accelerates in the positive direction down an inclined plane as shown by the graph below. Refer to the information and graph. What is the VELOCITY of the ball at t = 4 s?
30
2.5 m/s
5.0 m/s
10 m/s
20 m/s
Q 2/13
Score 0
A ball is released from rest and accelerates in the positive direction down an inclined plane as shown by the graph below. According to the information and graph, which best describes the motion of the ball?
30
Increasing velocity
Constant velocity
Decreasing velocity
Need more information
13 questions
Q.
A ball is released from rest and accelerates in the positive direction down an inclined plane as shown by the graph below. Refer to the information and graph. What is the VELOCITY of the ball at t = 4 s?
1
30 sec
112.39.c.4.a
Q.
A ball is released from rest and accelerates in the positive direction down an inclined plane as shown by the graph below. According to the information and graph, which best describes the motion of the ball?
2
30 sec
112.39.c.4.a
Q.
The graph below represents the motion of a car travelling horizontally along a straight stretch of road in the positive direction. Refer to the information and graph. Which best describes the magnitude of the velocity for the car?
3
30 sec
112.39.c.4.a
Q.
The graph below represents the motion of a car travelling horizontally along a straight
stretch of road in the positive direction.
According to the information and graph above, what is the displacement of the car between
t = 1 s and t = 4 s?
4
30 sec
112.39.c.4.a
Q.
The graph below represents the motion of a car traveling horizontally along a straight stretch of road in the positive direction. Refer to the information and graph. What is the average acceleration of the car during the time interval shown?
5
30 sec
112.39.c.4.a
Q.
Two students walk toward each other at constant velocity as shown in the position v. time graph below.
According to the information and graph, what does the intersection of the two graphs
represent?
6
30 sec
112.39.c.4.a
Q.
A cyclist is traveling along a level, straight road at 10 m/s in a positive direction with a
xi = 0. The magnitude of the velocity for the cyclist is tracked using the following motion graph.
The graph above represents the motion of a cyclist. Which of the following best describes the motion of the cyclist between t = 0 s and t = 2 s?
7
30 sec
112.39.c.4.a
Q.
A cyclist is traveling along a level, straight road at 10 m/s in a positive direction with a
xi = 0. The magnitude of the velocity for the cyclist is tracked using the following motion graph.
According to the information and graph above, how far will the cyclist be from his or her initial position after two seconds?
8
30 sec
112.39.c.4.a
Q.
An object initially at rest moves according to the Velocity - Time Graph shown below.
Refer to the information and graph. Which of the following time intervals demonstrates constant velocity?
9
30 sec
112.39.c.4.a
Q.
An object initially at rest moves according to the Velocity - Time Graph shown below.
Refer to the information and graph. Which interval has the greatest displacement?
10
30 sec
112.39.c.4.a
Q.
A cyclist is traveling along a level, straight road at 10 m/s in the positive direction with an xi = 0. The magnitude of the velocity for the cyclist is tracked using the following motion graph.
According to the information and graph shown above, what is the magnitude of the
acceleration for the first two seconds?
11
30 sec
112.39.c.4.a
Q.
A cyclist is traveling along a level, straight road at 10 m/s in the positive direction with an xi = 0. The magnitude of the velocity for the cyclist is tracked using the following motion graph.
Refer to the information and graph above. A stationary observer noted that the cyclist accelerated between t = 3 s and t = 4 s.
How did the cyclist accomplish this acceleration?
12
30 sec
112.39.c.4.a
Q.
An object initially at rest moves according to the Velocity - Time Graph shown below.
Refer to the information and graph. Which time interval has the greatest magnitude of
acceleration?