Loading...
Pictograms and Bar Chart
Quiz by michelle08 rw
Tag the questions with any skills you have. Your dashboard will track each student's mastery of each skill.
What type of graph is this?
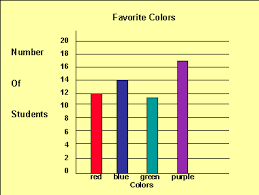
What type o graph is this?
What type of graph is this?
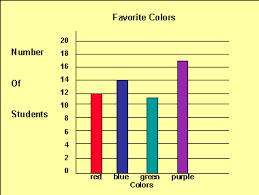
What type o graph is this?

How many students have blue for a favorite color?

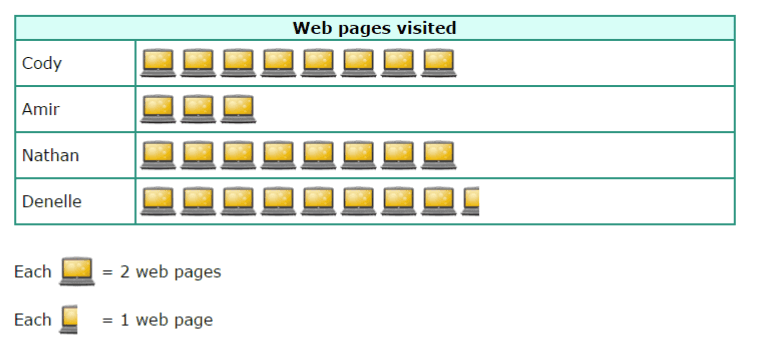
Who visited the same number of web pages?
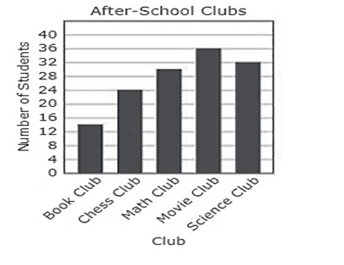
Based on the graph, how many more students are in the science club than the book club?
How many students voted for their favorite sport?

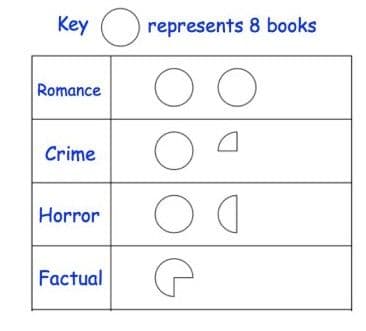
The pictogram shows the books Claire read last year.

The pictogram shows the books Claire read last year.
How many books in total did Claire read last year?
A manager surveys his employees to find out how they travel to work.

A manager surveys his employees to find out how they travel to work.
Calculate the total number of employees.

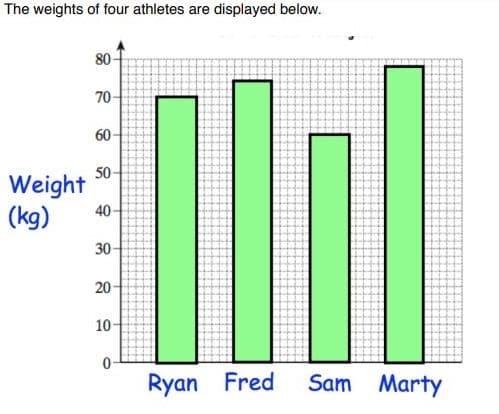
The weights of four athletes are displayed below. Write down Martyʼs weight.
The number of runs scored by a player in 4 consecutive years is shown below:
How many runs did the player score in the year 2003?
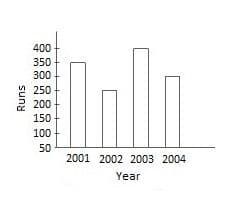
The number of runs scored by a player in 4 consecutive years is shown below:
What is total runs scored by him?

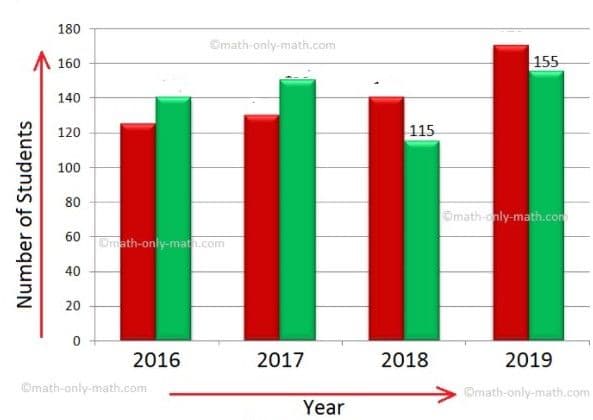
Observe the double bar graph given below and answer the questions.
How many students are there in grade 7 in the year 2018?
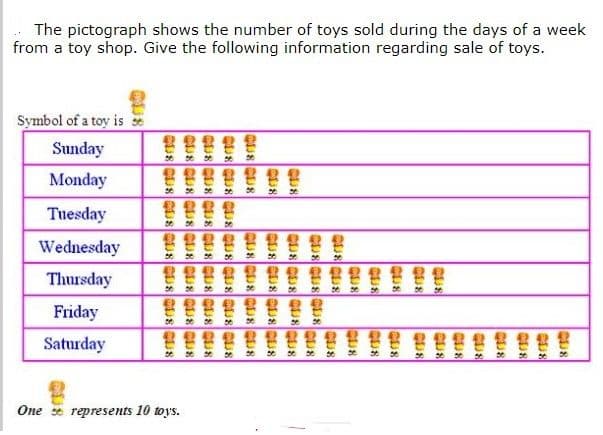
The pictograph shows the number of toys sold during the days of a week from a toy shop. Give the following information regarding sale of toys. On which day were the maximum numbers of toys sold?
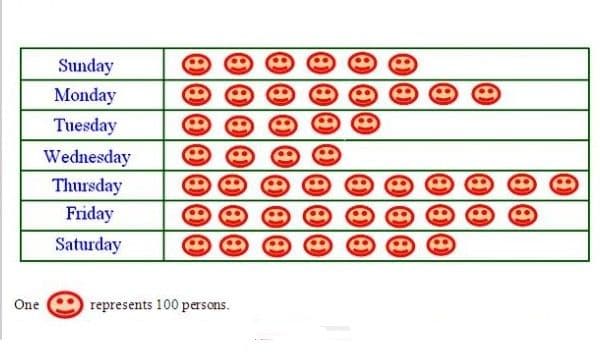
The pictograph given below expresses the number of persons who travelled from Varanasi to New Delhi by Shiva Ganga Express on each day of a week. Find the difference between the number of travelers who travelled in maximum and minimum numbers.
he pictograph given below shows the number of letters collected from the post-box in front of my house on each day of a certain week.
What was the total number of letters collected from the box over the whole week?
