Loading...
PISA SAMPLE QUESTIONS IN MATHEMATICS (HEALTH AND DISEASE)
Quiz by Armando, Jr. Dao
Tag the questions with any skills you have. Your dashboard will track each student's mastery of each skill.
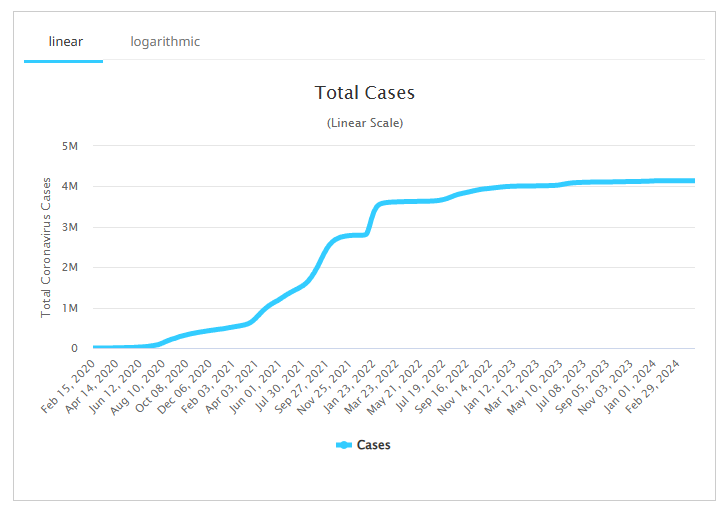
COVID-19 CASES
The total number of COVID-19 cases in the Philippines from February 2020 to February 2024 is shown in the graph below.
The values on the horizontal axis represent the total number of COVID-19 cases after 2020. Place the cursor in the graph to see the number of COVID-19 cases for each specific day. For example, on June 12, 2020, there were 24,395 COVID-19 cases.
A line has been added to the graph to model these data.
Based from the graph, was there a constant increase of COVID-19 cases from 2020 to 2024?

COVID-19 CASES
The total number of COVID-19 cases in the Philippines from February 2020 to February 2024 is shown in the graph below.
The values on the horizontal axis represent the total number of COVID-19 cases after 2020. Place the cursor in the graph to see the number of COVID-19 cases for each specific day. For example, on June 12, 2020, there were 24,395 COVID-19 cases.
A line has been added to the graph to model these data.
Let say the equation of the graph is given by an = 3(1.0337)n-1, where n is the number of COVID-19 cases.
If this trend continues, how many COVID-19 cases during February 4, 2021?
COVID-19 CASES
The total number of COVID-19 cases in the Philippines from February 2020 to February 2024 is shown in the graph below.
The values on the horizontal axis represent the total number of COVID-19 cases after 2020. Place the cursor in the graph to see the number of COVID-19 cases for each specific day. For example, on June 12, 2020, there were 24,395 COVID-19 cases.
A line has been added to the graph to model these data.
Based from the graph, was there a constant increase of COVID-19 cases from 2020 to 2024?

COVID-19 CASES
The total number of COVID-19 cases in the Philippines from February 2020 to February 2024 is shown in the graph below.
The values on the horizontal axis represent the total number of COVID-19 cases after 2020. Place the cursor in the graph to see the number of COVID-19 cases for each specific day. For example, on June 12, 2020, there were 24,395 COVID-19 cases.
A line has been added to the graph to model these data.
Let say the equation of the graph is given by an = 3(1.0337)n-1, where n is the number of COVID-19 cases.
If this trend continues, how many COVID-19 cases during February 4, 2021?

COVID-19 CASES
The total number of COVID-19 cases in the Philippines from February 2020 to February 2024 is shown in the graph below.
The values on the horizontal axis represent the total number of COVID-19 cases after 2020. Place the cursor in the graph to see the number of COVID-19 cases for each specific day. For example, on June 12, 2020, there were 24,395 COVID-19 cases.
A line has been added to the graph to model these data.
Based from the graph, what are the sales trend and mathematical model that best fit these data for the month/year ranges from February 2020 to November 2021?

MEASLES OUTBREAK
Brgy. Don Salvador Lopez in Mati City experienced a measles outbreak in July 2019. The City Health Office reported that there were 24 cases, in which two fatalities among one-year-old children. Purok Gemelina, which is known home to a religious group that opposes medical treatment, was reported as the main source were the measles outbreak concentrated, which resulted in low immunization rates.
The data is presented in the table below. What is the percentage of the total population in Brgy. Don Salvador Lopez who were contracted with measles during the outbreak?

MEASLES OUTBREAK
Brgy. Don Salvador Lopez in Mati City experienced a measles outbreak in July 2019. The City Health Office reported that there were 24 cases, in which two fatalities among one-year-old children. Purok Gemelina, which is known home to a religious group that opposes medical treatment, was reported as the main source were the measles outbreak concentrated, which resulted in low immunization rates.
The data is presented in the table below. Which factor mostly contributed to the high number of measles cases in Purok Gemelina?

MEASLES OUTBREAK
Brgy. Don Salvador Lopez in Mati City experienced a measles outbreak in July 2019. The City Health Office reported that there were 24 cases, in which two fatalities among one-year-old children. Purok Gemelina, which is known home to a religious group that opposes medical treatment, was reported as the main source were the measles outbreak concentrated, which resulted in low immunization rates.
The data is presented in the table below. How should the outbreak be prevented in Purok Gemelina?

MALNUTRITION AND CALORIC INTAKE
Malnutrition remains a significant concern especially among children in the Philippines. The recommended daily caloric intake (C) for a child is determined by the formula, C = 30w + 700, where w is the child’s weight in kilograms (kg). The table below shows the average weight (kg) of children in different regions in the Philippines and their caloric intake requirements based on the formula.
The data is presented in the table below. Using the formula , what could be the recommended caloric intake for a child in the NCR (Metro Manila)?

MALNUTRITION AND CALORIC INTAKE
Malnutrition remains a significant concern especially among children in the Philippines. The recommended daily caloric intake (C) for a child is determined by the formula, C = 30w + 700, where w is the child’s weight in kilograms (kg). The table below shows the average weight (kg) of children in different regions in the Philippines and their caloric intake requirements based on the formula.
The data is presented in the table below. If a child living in BARMM consumes only 1,100 kcal per day, how much lower is their intake compared to the recommended value?

MALNUTRITION AND CALORIC INTAKE
Malnutrition remains a significant concern especially among children in the Philippines. The recommended daily caloric intake (C) for a child is determined by the formula, C = 30w + 700, where w is the child’s weight in kilograms (kg). The table below shows the average weight (kg) of children in different regions in the Philippines and their caloric intake requirements based on the formula.
The data is presented in the table below. Which of the following correctly represents the caloric intake function when doubled to account for two children?

COVID-19 CASES AND VACCINATION RATES
The number of COVID-19 cases in a community is affected by the vaccination rate (V). The health experts modeled the relationship between new cases (N) and vaccination rate (%) using the equation, N = 1,000 - 8V, where V is the percentage of the population vaccinated, and N represents the estimated new COVID-19 cases per month.
The data is presented in the table below. If no one in the community is vaccinated, V = 0, how many new cases are expected?

COVID-19 CASES AND VACCINATION RATES
The number of COVID-19 cases in a community is affected by the vaccination rate (V). The health experts modeled the relationship between new cases (N) and vaccination rate (%) using the equation, N = 1,000 - 8V, where V is the percentage of the population vaccinated, and N represents the estimated new COVID-19 cases per month.
The data is presented in the table below. What will be the number of new COVID-19cases when 75% of the population is vaccinated?

COVID-19 CASES AND VACCINATION RATES
The number of COVID-19 cases in a community is affected by the vaccination rate (V). The health experts modeled the relationship between new cases (N) and vaccination rate (%) using the equation, N = 1,000 - 8V, where V is the percentage of the population vaccinated, and N represents the estimated new COVID-19 cases per month.
The data is presented in the table below. If the goal is to reduce new cases to 0, what percentage of the population must be vaccinated?
