Loading...
PISA Summative - MATH
Quiz by JOHANNES T. LATRAS
Tag the questions with any skills you have. Your dashboard will track each student's mastery of each skill.
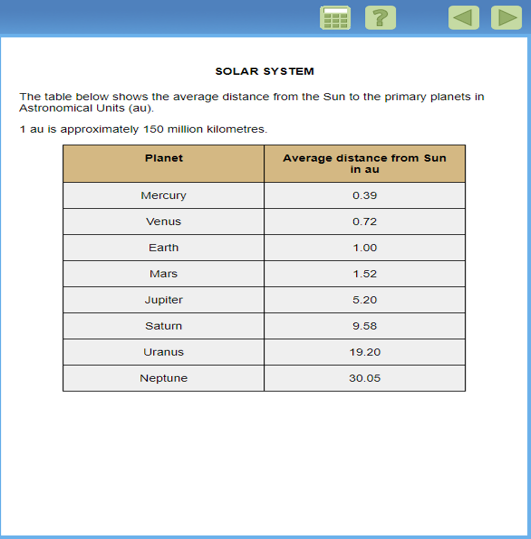
SOLAR SYSTEM
On average, approximately how many million kilometers from the Sun is the planet Neptune?
180 million km
30 million km
4500 million km
5 million km
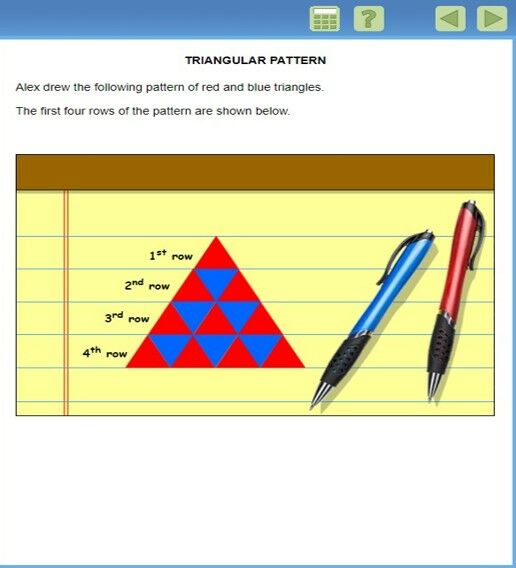
TRIANGULAR PATTERN
What percentage of the triangles in the first four rows of Alex's pattern are blue?
50 %
62.5 %
37.5 %
60 %
SOLAR SYSTEM
On average, approximately how many million kilometers from the Sun is the planet Neptune?

TRIANGULAR PATTERN
What percentage of the triangles in the first four rows of Alex's pattern are blue?

TRIANGULAR PATTERN
If Alex were to extend the pattern to a fifth row, what would be the percentage of blue triangles in all five rows of the pattern?

TRIANGULAR PATTERN
Alex is going to add more rows to his pattern.
He claims that the percentage of blue triangles in the pattern will always be less than 50%
Is Alex correct?
ENERGY CONSUMPTION IN HOMES
Rank the energy consumption in Homes below.
Rank the roof colors from highest to lowest in terms of energy consumption at 35 degrees Celsius.

ENERGY CONSUMPTION IN HOMES
If energy costs Php 5 per kWh, calculate the energy cost for each roof color at 35 degrees Celsius.

ENERGY CONSUMPTION IN HOMES
Explain why the white roof consumes the least energy compared to the black roof.

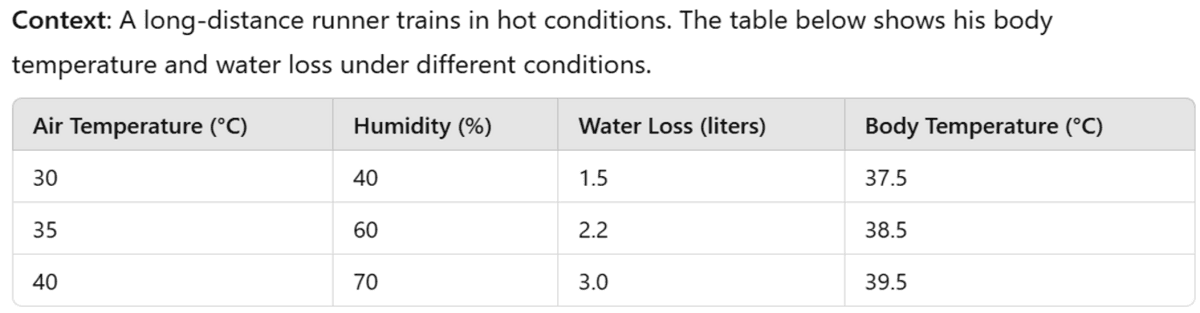
RUNNING IN HOT WEATHER
What is the relationship between air temperature and water loss?

RUNNING IN HOT WEATHER
At what air temperature and humidity is the runner most at risk of dehydration?

RUNNING IN HOT WEATHER
Which graph correctly shows water loss versus air temperature?
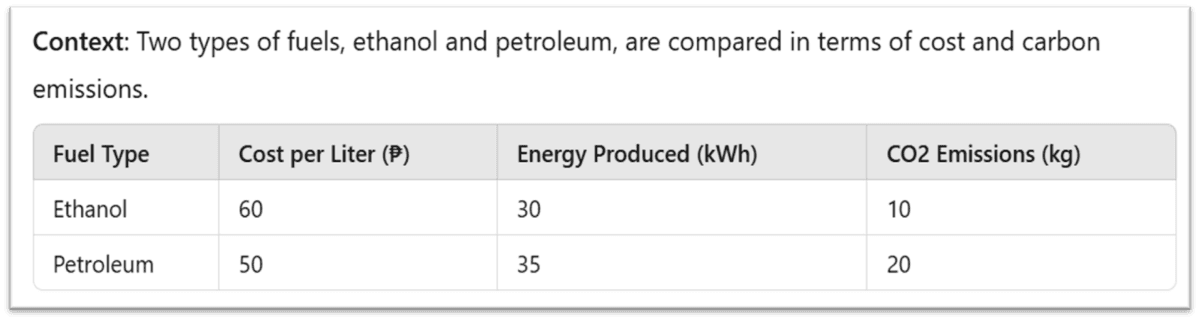
COST OF BIOFUELS
Which fuel is more cost-effective based on energy produced per peso?
COST OF BIOFUELS
Which fuel has a lower environmental impact?

COST OF BIOFUELS
If a vehicle requires 100 kWh of energy, what are the total costs and CO2 emissions for both fuel types?

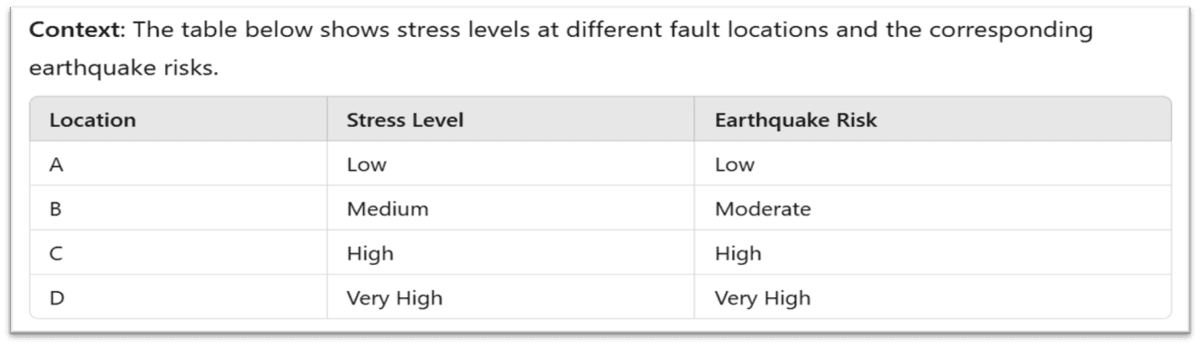
EARTHQUAKE RISK ANALYSIS
Which bar chart correctly represents earthquake risks for Locations A B C and D?

EARTHQUAKE RISK ANALYSIS
Which location is the safest, and why?
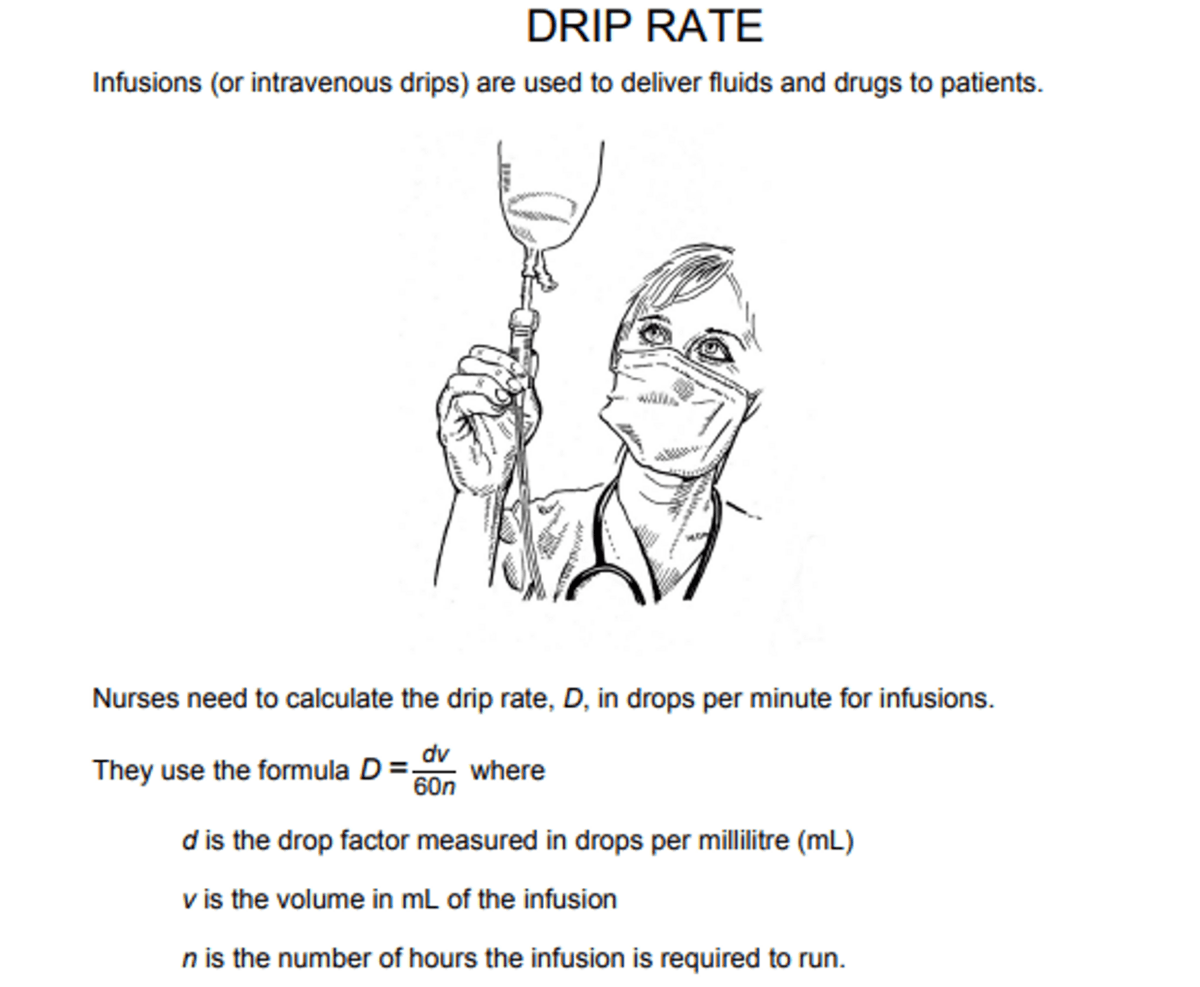
DRIP RATE
A nurse wants to double the time an infusion runs for.
Describe precisely how D changes in n is doubled but d and v do not change

DRIP RATE
Nurse also need to calculate the volume of the infusion, v from the drip rate, D.
An infusion with a drip rate of 50 drops per minute has to be given to a patient for 3 hours. For this infusion, the drop factor is 25 drops per milliliter.
What is the volume in mL of the infusion?
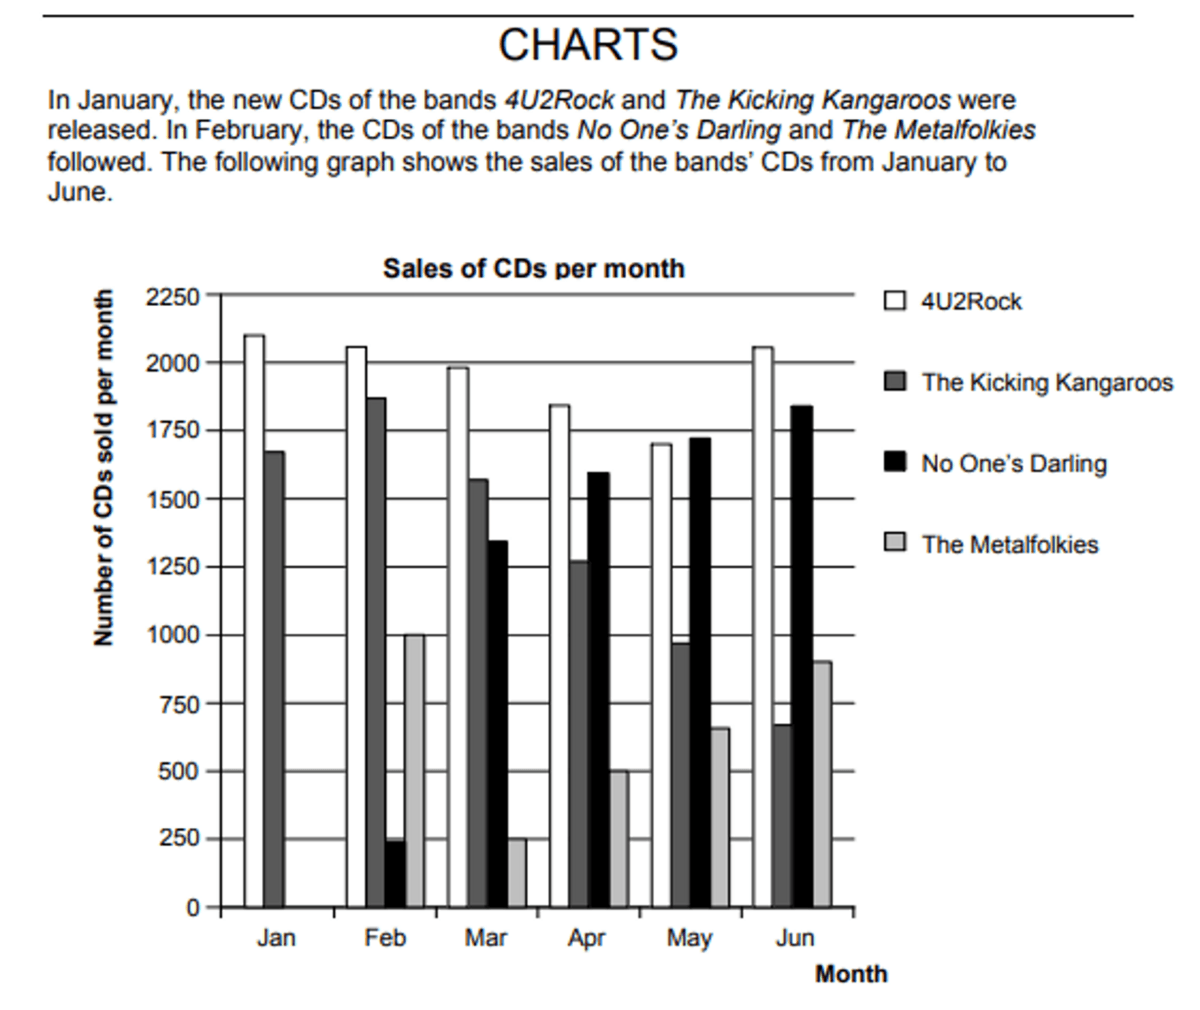
CHARTS
How many CDs did the band The Metalfolkies sell in April?

CHARTS
In which month did the band No One's Daring sell more CDs than the other band The Kicking Kangaroos for the first time?

CHARTS
The manager of the Kicking Kangaroos is worried because the number of their CDs that sold decreased from February to June.
What is the estimate of their sales volume for July if the same negative trend continues?
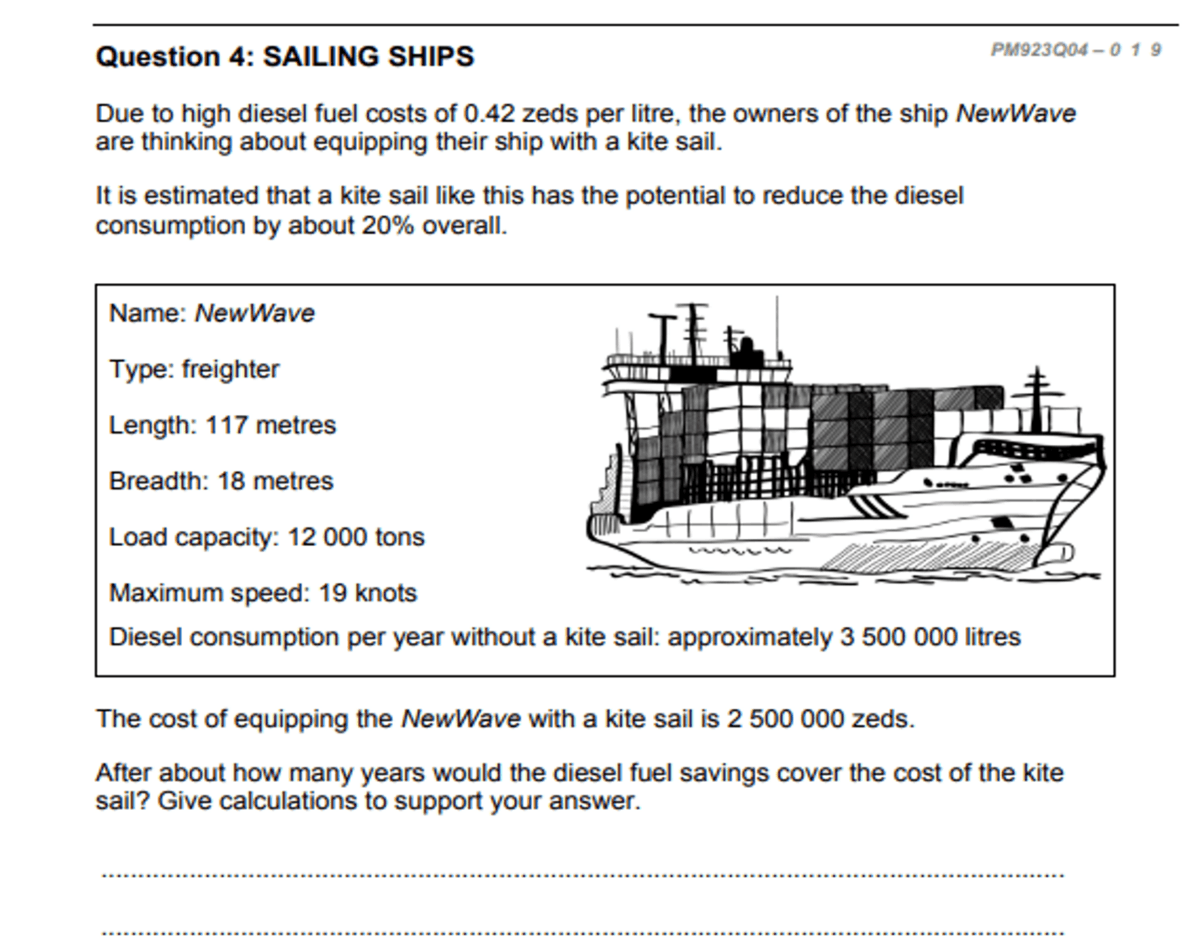
SAILING SHIPS

SAILING SHIPS
Approximately what is the length of the rope for the kite sail, in order to pull the ship at an angle of 45 degrees and be at a vertical height of 150 m, as shown in the diagram?
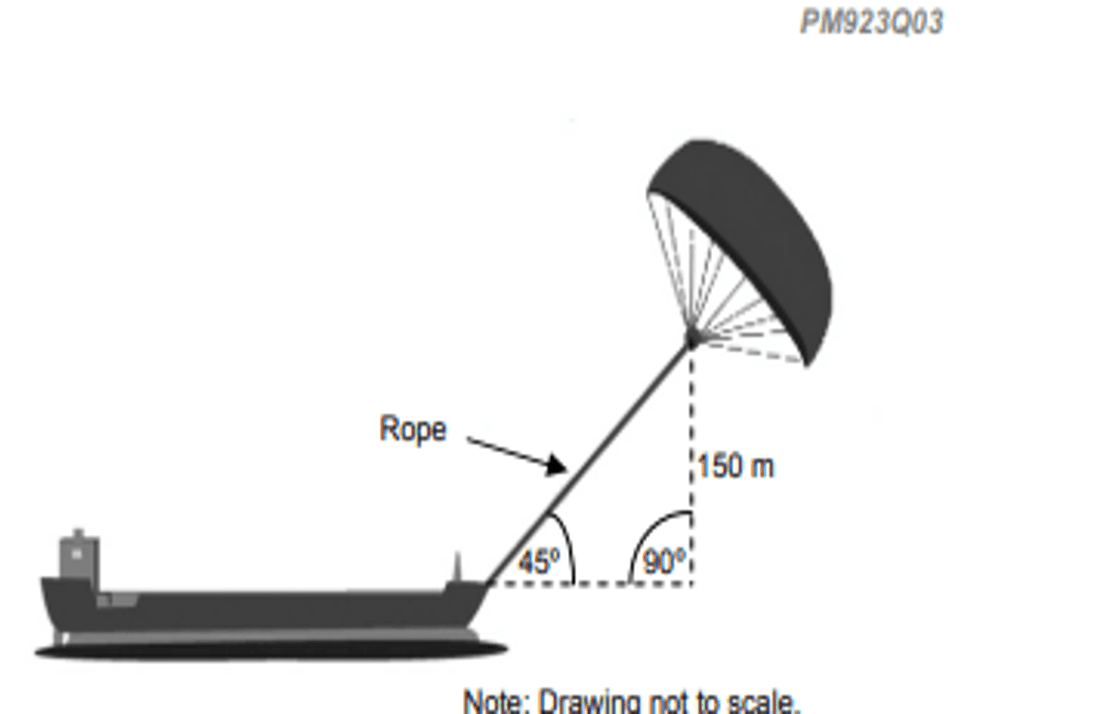
SAILING SHIPS
SAUCE

FERRIS WHEEL
The letter M in the diagram indicates the center of the wheel.
How many meters above the bed of the river is point M?
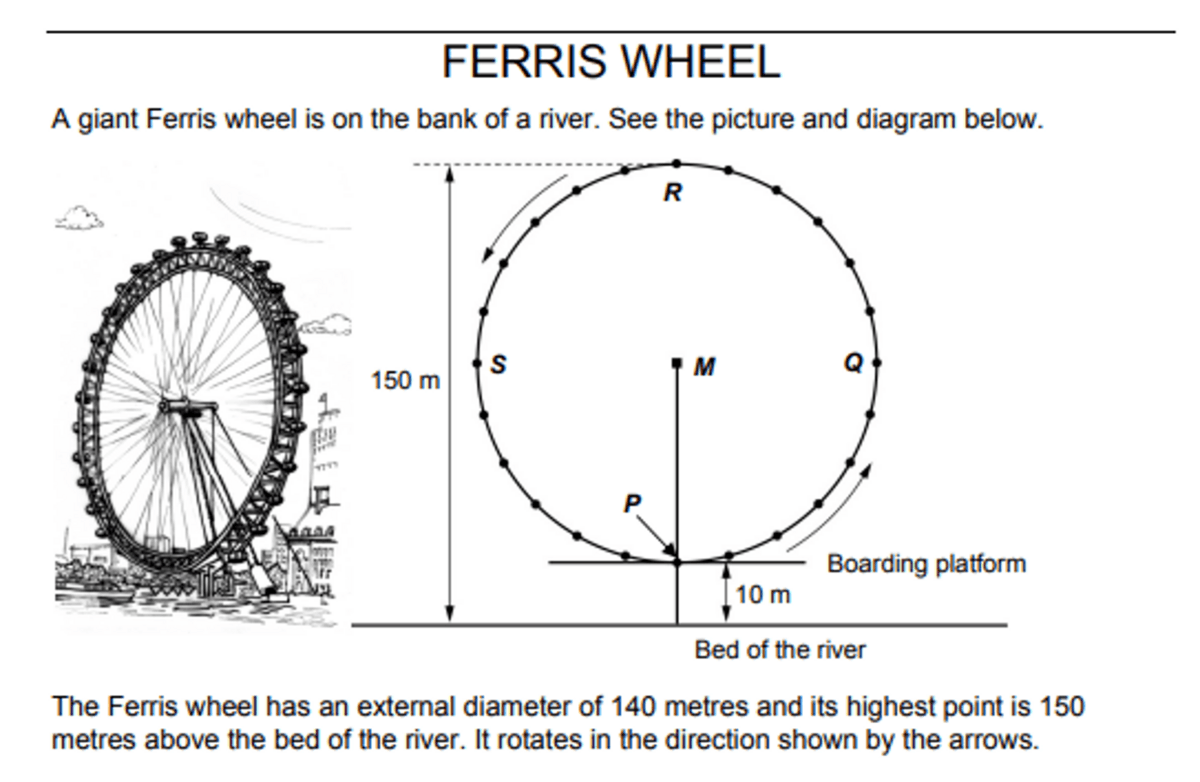
FERRIS WHEEL
The ferris wheel rotates at a constant speed. The wheel makes one full rotation in exactly 40 minutes.
John starts his ride on the ferris wheel at the boarding point, P.
Where will John be after an hour?

MOUNT FUJI
Mount Fuji is only open to the public for climbing from July 1 to 27 August each year. About 200,000 people climb Mount Fuji during this time.
On average, about how many people climb Mount Fuji each day?

MOUNT FUJI

MOUNT FUJI
HELEN THE CYCLIST
On one trip, Helen rode 4 km in the first 10 minutes and then 2 km in the next 5 minutes.
Which one of the following statement is correct?

HELEN THE CYCLIST
Helen rode 6 km to her aunt's house. Her speedometer showed that she had averaged 18km/h for the whole trip.
Which one of the following statements is correct?
HELEN THE CYCLIST

WHICH CAR?
Chris wants a car that meets all these conditions:
-The distance travelled is not higher than 120,000 kilometers
-It was wade in the year 2000 or a year later.
-The advertised price is not higher than 4500 zeds
Which car meets Chris's conditions?
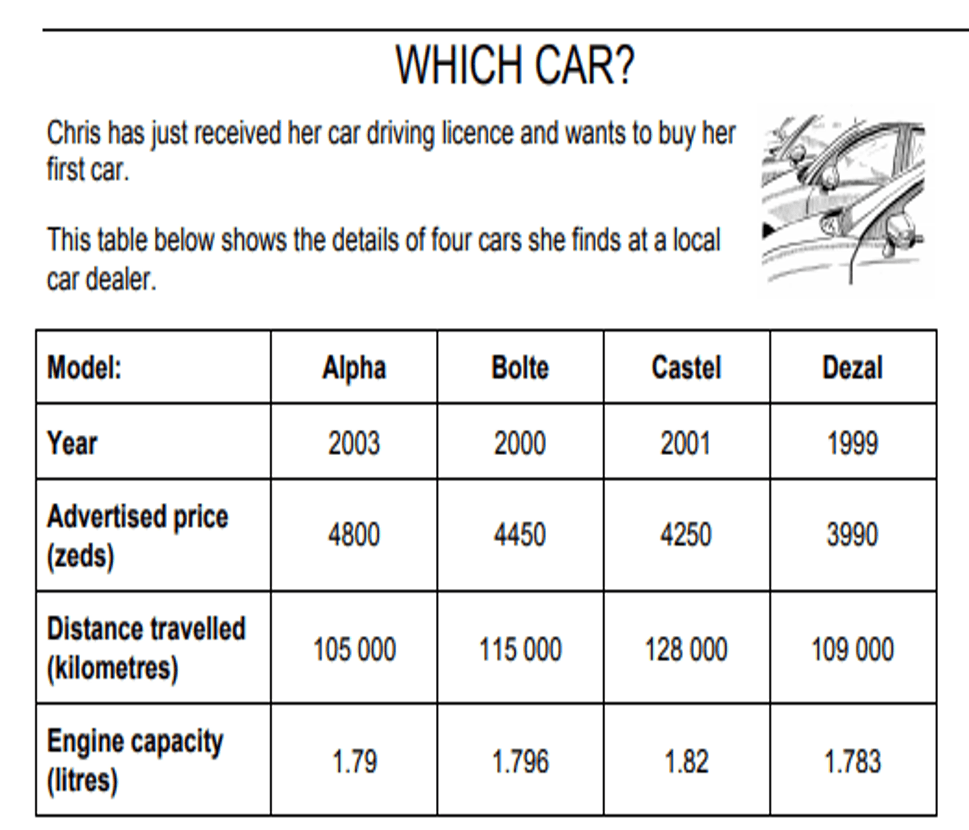
Which car's engine capacity is the smallest?

Chris will have to pay an extra 2.5% of the advertised cost of the car as taxes. How much are the extra taxes for the Alpha?
Extra taxes in zeds: ________
