Loading...
Principles of Transportation Engineering
Quiz by Lance Daniel Moreno
Customize this quiz to suit your class
Instantly translate to 100+ languages
Tag the questions with any skills you have. Your dashboard will track each student's mastery of each skill.
Give this quiz to my class
The average of 24-hour traffic counts collected every day in the year.
Average annual daily traffic (AADT)
Average daily traffic (ADT)
Vehicle miles of travel (VMT)
Peak hour volume (PHV)
The average of 24-hour traffic counts collected over a number of days greater than one but less than a year.
Peak hour volume (PHV)
Average daily traffic (ADT)
Average annual daily traffic (AADT)
Vehicle miles of travel (VMT)
The average of 24-hour traffic counts collected every day in the year.
The average of 24-hour traffic counts collected over a number of days greater than one but less than a year.
The maximum number of vehicles that pass a point on a highway during a period of 60 consecutive minutes.
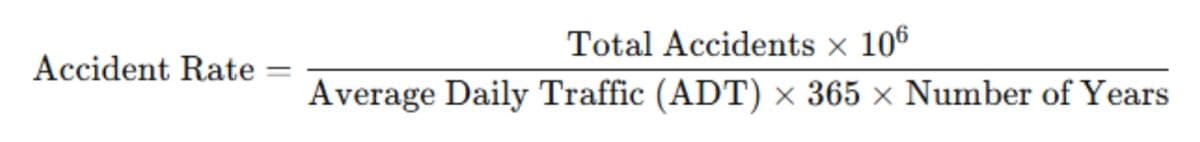
The number of accidents for 6 years recorded in a certain section of a highway is 589. If the average daily traffic is 476, determine the accident rate per million entering vehicles.
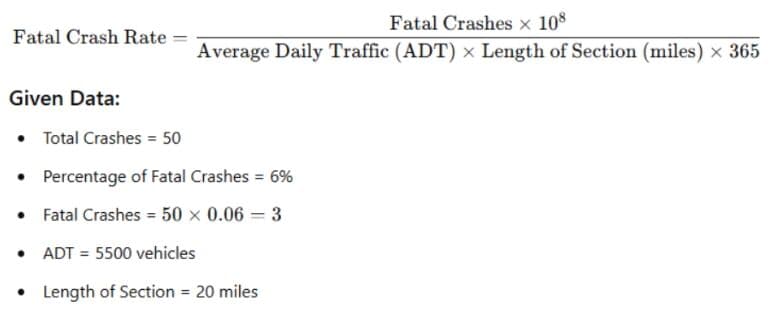
It is observed that 50 traffic crashes occurred on a 20-mile long section of Route 120 in one year. If the average daily traffic on the section was 5500 vehicles determine the rate of fatal crashes per 100 million vehicle-mile if 6% of the crashes involved fatalities.
Data on a traffic accident recorded on a certain intersection for the past 5 years has an accident rate of 416 per million entering vehicles. If the average daily traffic entering the intersection is 504 find the total number accidents during the 5 year period.
Passenger cars arrive at the stop sign at an average rate of 280 per hour. Average departure time at the stop sign is 12 sec. If both arrivals and departures are exponentially distributed, what would be the average waiting time per vehicle in minutes?
A stop sign is installed in one of the road intersections. Rate of arrival at a stop sign is 300 veh/hr and the average waiting time at the stop sign is 10 sec. per vehicle. If both arrivals and departures are exponentially distributed, determine the average queue length.
The number of vehicles occupying a unit length of lane roadway at a given instant, usually expressed in vehicle per kilometer.
The difference between the time the front of a vehicle arrives at a point on the highway and the time the front of the next vehicle arrives at the same point.
The arithmetic mean of the speeds of vehicles passing a point on a highway during an interval of time.
The harmonic mean of the speed of vehicles passing a point on a highway during an interval of time. It is obtained by dividing the total distance travelled by two or more vehicles on a section of a highway by the total time required by these vehicles to travel that distance.
Three cars travel over a 60 m. section of highway at constant speeds of 19, 20 and 25 m/s. Compute the time mean speed for this condition.
There are 9 vehicles observed in a 300 m section of McArthur highway. If the average time headway is 4 sec., compute the space mean speed of the vehicles in kph
The rate flow at a point in the highway is 1200 vehicles/hour. Find the space mean speed if the density of traffic is 25 vehicles per mile.
Compute the rate of flow in vehicles per hour if the space mean speed is 30 mph and the density is 14 vehicles per km
Assume you are observing traffic in a single lane of McArthur Highway at a specific location. You measure the average headway and average spacing of the vehicles as 3.2sec. and 50 m. respectively. Determine the traffic flow in vehicle/hour.
If the density of traffic in Aurora Blvd. is 30 veh/km and the average headway is 4sec., compute the space mean speed.
Compute the peak hour factor if the hourly volume of traffic is 1800 vehicles/hour and the highest 15-min. volume is 750.
The spacing of the cars moving along the same lane of an expressway is 40 m center to center. If the average velocity of the car is 80 kph, determine the volume of traffic in veh/hr.
In a given instant, there were 2400 vehicles counted at a specific point along the portion of the TPLEX. The highway was designed to have a capacity of 3000 veh/hr with a free-flow speed of 60 kph. Compute the maximum value of the jam density that could possibly occur during heavy traffic assuming linear speed-density relationship applies.
A signalized intersection has a cycle length of 70 seconds. For one traffic movement, the displayed all-red time is set to two seconds while the displayed yellow time is five seconds. The effective red time is 37 seconds and the total lost time per cycle for the movement is four seconds. What is the displayed green time for the traffic movement?
The instantaneous speed of a vehicle at a specified section or location.
The maximum number of passenger cars that can pass a given point on a lane or roadway during one hour under the most nearly ideal roadway and traffic conditions which can possibly be attained.
Situation I (Nos. 25-26): Five vehicles were observed traveling a one-kilometer segment of the NLEX with the following travel times (in minutes), respectively: 1.19, 1.22, 1.36, 1.48, and 1.51.
Determine the time-mean speed in km/hr.
Situation I (Nos. 25-26): Five vehicles were observed traveling a one-kilometer segment of the NLEX with the following travel times (in minutes), respectively: 1.19, 1.22, 1.36, 1.48, and 1.51.
Determine the space-mean speed in km/hr.
Situation II (Nos. 27-28): The SLEX was designed to carry a free-flow speed of 50 kph and a capacity of 4000 veh/hr. At a certain point near the intersection of a road leading to Laguna, there were 3600 vehicles.
Determine the space-mean speed.
Situation II (Nos. 27-28): The SLEX was designed to carry a free-flow speed of 50 kph and a capacity of 4000 veh/hr. At a certain point near the intersection of a road leading to Laguna, there were 3600 vehicles.
Determine the space-mean speed. (if jam density)
Situation III (Nos. 29-31): Six vehicles were observed in a 200 m section of a highway. If the average time headway is 4 sec .
Determine the density in vehicle/kilometre.
Situation III (Nos. 29-31): Six vehicles were observed in a 200 m section of a highway. If the average time headway is 4 sec.
Determine the flow of traffic in vehicle/hour.
Situation III (Nos. 29-31): Six vehicles were observed in a 200 m section of a highway. If the average time headway is 4 sec.
Determine the space-mean speed in kilometre/hour.
The illumination of one or more signal lenses indicating a permitted or prohibited traffic movement.
The maximum flow that could pass through an intersection from a given approach, if that approach was allocated all of the cycle time as effective green with no lost time.
The maximum flow that can pass through an intersection under prevailing highway and traffic conditions, given the effective green time allocated to the approach.
Approximated as the green time plus the change interval minus the lost time for the approach.
The actual rate of flow for the peak 15-min period expanded to an hourly volume.
The jam density on the approach of the traffic flow on a single lane of Juan Luna St. is 120 veh/km, with a density on the approach of 40 veh/km. If the space-mean speed is 40 kph, determine the free-flow speed in kph.
Divided arterial highway for through traffic with full access control.
The number of vehicles that can enter the onramp of Subic-Clark Expressway is controlled by a metering system. If the vehicles can enter the expressway at a rate of 500 veh/hr, and the rate of arrival of the vehicles at the on-ramp is 400 veh/hr during the peak hour. Determine the expected number of units waiting to be served in the system.
The average queue length at the intersection of the two roads with a stop sign is 4 vehicles. If the arrival rate of vehicles at the stop sign is 300 veh/hr, determine the service rate of the road in veh/hr. Assume both arrival and departure rates are exponentially distributed.
Passenger cars arrive at the stop sign at an average rate of 280 per hour. Average waiting time at the stop sign is 12 sec. If both arrivals and departures are exponentially distributed, what would be the average delay per vehicle in minutes. Assume both arrival and departure rates are exponentially distributed.
A work-mode-choice model is developed from data acquired in the field in order to determine the probabilities of individual travelers selecting various modes. The mode choices include automobile drive alone (DL), automobile shared ride (SR), and bus (B). The utility functions are estimated as:
where cost is in dollars and time is in minutes. The cost of driving an automobile is $5.50 with a travel time of 21 minutes, while the bus fare is $1.25 with a travel time of 27 minutes. How many people will use the shared-ride mode from a community of 4500 workers, assuming the shared-ride option always consists of three individuals sharing costs equally?

Situation Problem:
A six-lane freeway (three lanes in each direction) in rolling terrain has 10-ft lanes and obstructions (fLW = 6.0 mph) 4 ft from the right edge of the traveled pavement (fLC = 0.8 mph). There are five ramps within three miles upstream of the segment midpoint and four ramps within three miles downstream of the segment midpoint. A directional peak-hour volume of 2000 vehicles (primarily commuters) is observed, with 600 vehicles arriving in the highest 15-min flow rate period. The traffic stream contains 12% large trucks (ET = 2.5) and buses and 6% recreational vehicles (ER = 2.0).
What is the estimated free-flow speed of the traffic stream?
A six-lane freeway (three lanes in each direction) in rolling terrain has 10-ft lanes and obstructions (fLW = 6.0 mph) 4 ft from the right edge of the traveled pavement (fLC = 0.8 mph). There are five ramps within three miles upstream of the segment midpoint and four ramps within three miles downstream of the segment midpoint. A directional peak-hour volume of 2000 vehicles (primarily commuters) is observed, with 600 vehicles arriving in the highest 15-min flow rate period. The traffic stream contains 12% large trucks (ET = 2.5) and buses and 6% recreational vehicles (ER = 2.0).
What is the peak-hour factor
A six-lane freeway (three lanes in each direction) in rolling terrain has 10-ft lanes and obstructions (fLW = 6.0 mph) 4 ft from the right edge of the traveled pavement (fLC = 0.8 mph). There are five ramps within three miles upstream of the segment midpoint and four ramps within three miles downstream of the segment midpoint. A directional peak-hour volume of 2000 vehicles (primarily commuters) is observed, with 600 vehicles arriving in the highest 15-min flow rate period. The traffic stream contains 12% large trucks (ET = 2.5) and buses and 6% recreational vehicles (ER = 2.0).
What is the heavy-vehicle adjustment factor?
A six-lane freeway (three lanes in each direction) in rolling terrain has 10-ft lanes and obstructions (fLW = 6.0 mph) 4 ft from the right edge of the traveled pavement (fLC = 0.8 mph). There are five ramps within three miles upstream of the segment midpoint and four ramps within three miles downstream of the segment midpoint. A directional peak-hour volume of 2000 vehicles (primarily commuters) is observed, with 600 vehicles arriving in the highest 15-min flow rate period. The traffic stream contains 12% large trucks (ET = 2.5) and buses and 6% recreational vehicles (ER = 2.0).
What is the service flow rate?
A six-lane freeway (three lanes in each direction) in rolling terrain has 10-ft lanes and obstructions (fLW = 6.0 mph) 4 ft from the right edge of the traveled pavement (fLC = 0.8 mph). There are five ramps within three miles upstream of the segment midpoint and four ramps within three miles downstream of the segment midpoint. A directional peak-hour volume of 2000 vehicles (primarily commuters) is observed, with 600 vehicles arriving in the highest 15-min flow rate period. The traffic stream contains 12% large trucks (ET = 2.5) and buses and 6% recreational vehicles (ER = 2.0).
What is the service measure value if the average speed of the traffic stream is 65 mph?
Situation IV (Nos. 32-34): A study showed that during the peak-hour commute on two routes connecting a suburb with a large city, there are a total of 5500 vehicles that make the trip. Route 1 is 7 miles long with a 65-mi/h speed limit and route 2 is 4 miles long with a speed limit of 50 mi/h. The study also found that the travel time on Route 2 increases with the square of the number of vehicles, while the route 1 travel time increases two minutes for every 500 additional vehicles added.
Determine the number of vehicles per hour using Route 1.
Situation IV (Nos. 32-34): A study showed that during the peak-hour commute on two routes connecting a suburb with a large city, there are a total of 5500 vehicles that make the trip. Route 1 is 7 miles long with a 65-mi/h speed limit and route 2 is 4 miles long with a speed limit of 50 mi/h. The study also found that the travel time on Route 2 increases with the square of the number of vehicles, while the route 1 travel time increases two minutes for every 500 additional vehicles added.
Determine the number of vehicles per hour using Route 2
Situation IV (Nos. 32-34): A study showed that during the peak-hour commute on two routes connecting a suburb with a large city, there are a total of 5500 vehicles that make the trip. Route 1 is 7 miles long with a 65-mi/h speed limit and route 2 is 4 miles long with a speed limit of 50 mi/h. The study also found that the travel time on Route 2 increases with the square of the number of vehicles, while the route 1 travel time increases two minutes for every 500 additional vehicles added.
Determine the user-equilibrium travel time in minutes.