Tag the questions with any skills you have. Your dashboard will track each student's mastery of each skill.
Give this quiz to my class
Q 1/6
Score 0
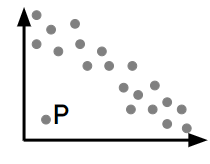
Lucas plots this scatter graph. He says, “Point P must be an error.” Is Lucas definitely correct?
30
Yes, the point does not fit the rest of the data.
It depends, outliers should be investigated further.
No, it is just an unusual result.
Q 2/6
Score 0
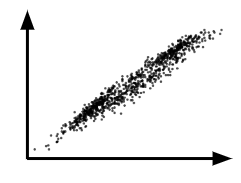
This scatter graph shows positive correlation. Which of these Oak pupils are correct?
30
Users sort answers between categories
6 questions
Q.
Lucas plots this scatter graph. He says, “Point P must be an error.” Is Lucas definitely correct?
1
30 sec
Q.
This scatter graph shows positive correlation. Which of these Oak pupils are correct?
2
30 sec
Q.
______ is when you estimate values that are outside the range of available data.
3
30 sec
Q.
The time series graph shows data about the number of daily internet users in England. Sam says, “I can use the graph to predict there will be 90 million internet users in Wales in 2050.” Is Sam right?
4
30 sec
Q.
A scatter graph is a visual representation for ______ data.
5
30 sec
Q.
A reporter writes the following headline for the Oak Daily News. Which of these Oak pupils are correct?