Loading...
Production Possibility Curves
Quiz by Dyas Rakhmasary
Customize this quiz to suit your class
Instantly translate to 100+ languages
Tag the questions with any skills you have. Your dashboard will track each student's mastery of each skill.
Give this quiz to my class
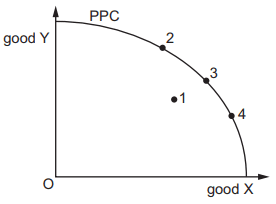
Country Z operates with a production possibility curve (PPC). Currently, output is at combination 1. Which movement has zero opportunity cost in terms of the goods produced?
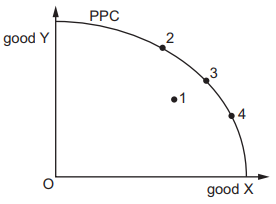
1 to 3
1 to 2
3 to 4
2 to 3
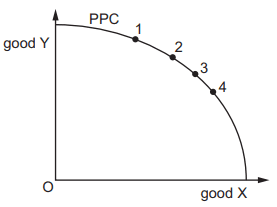
PPC is the production possibility curve in country T. Which changes take place in country T’s opportunity costs of producing X as it increases production of X?
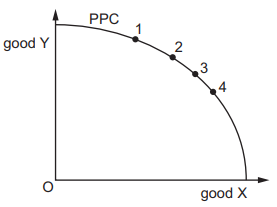
Opportunity costs increase between points 1 and 2, and between points 3 and 4.
Opportunity costs decrease between points 1 and 2, and between points 3 and 4.
Opportunity costs decrease between points 1 and 2, and increase between points 3 and 4.
Opportunity costs are constant between points 1 and 2, and between points 3 and 4.
Country Z operates with a production possibility curve (PPC). Currently, output is at combination 1. Which movement has zero opportunity cost in terms of the goods produced?
PPC is the production possibility curve in country T. Which changes take place in country T’s opportunity costs of producing X as it increases production of X?
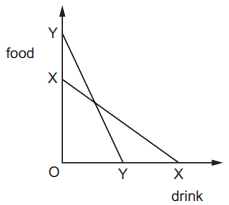
The diagram shows the change in a country’s production possibility curve from XX to YY. What would explain this change?
Assuming nothing else changes, which change in an economy’s labour market will cause the production possibility curve to shift to the left?
The diagram shows the production possibility curve for wheat and corn. What can be deduced from the diagram?
