Proteins and Enzyme IB bio
Quiz by Texel, Sarah J
Feel free to use or edit a copy
includes Teacher and Student dashboards
Measure skillsfrom any curriculum
Measure skills
from any curriculum
Tag the questions with any skills you have. Your dashboard will track each student's mastery of each skill.
With a free account, teachers can
- edit the questions
- save a copy for later
- start a class game
- automatically assign follow-up activities based on students’ scores
- assign as homework
- share a link with colleagues
- print as a bubble sheet
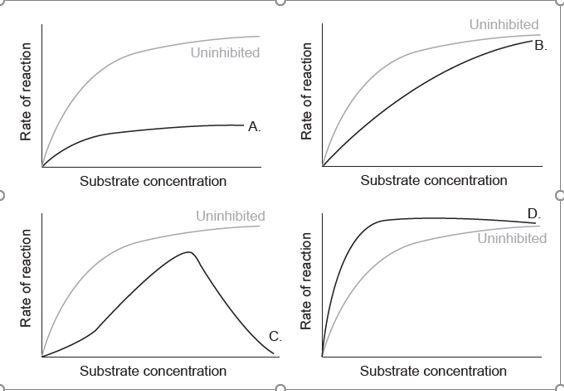
- Q 1/15Score 0The grey line in each of the graphs below represents the rate of reaction catalysed by an uninhibited enzyme as substrate concentration is increased. Which graph shows expected results if a competitive inhibitor was added to the reaction?29dbca


15 questions
Show answers
- Q1The grey line in each of the graphs below represents the rate of reaction catalysed by an uninhibited enzyme as substrate concentration is increased. Which graph shows expected results if a competitive inhibitor was added to the reaction?dbca30s
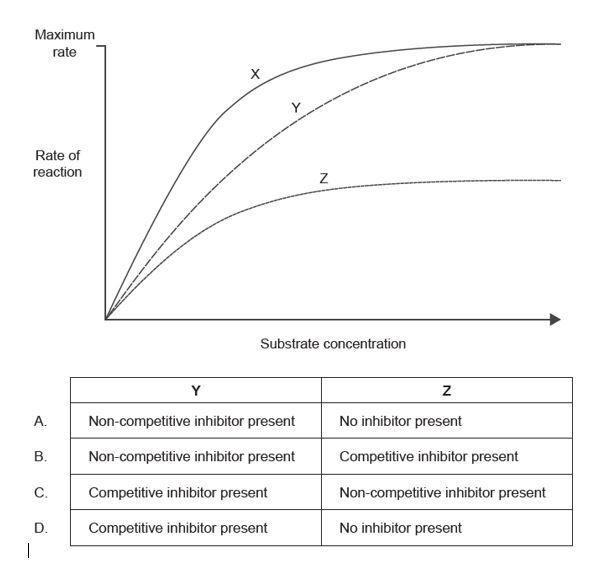
- Q2The graph shows the rate of an enzymatic reaction versus the substrate concentration, in the absence or presence of an enzyme inhibitor. Which condition is indicated by lines Y and Z?dcab30s
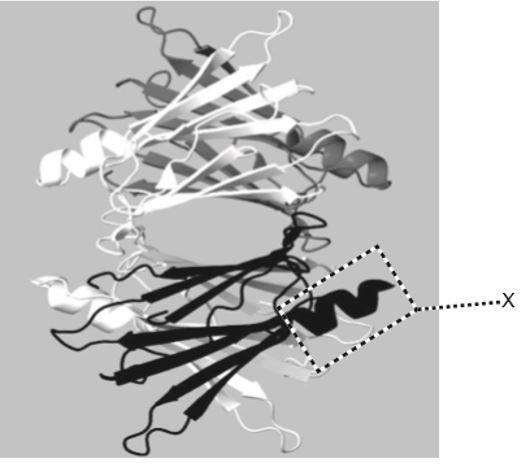
- Q3Which level of structure is indicated by X on the image?TertiarySecondaryPrimaryQuaternary30s
- Q4What determines the primary structure of hemoglobin?Genetic informationFour polypeptide chainsSide chain interactionsHydrogen bonding30s
- Q5Which protein has the highest tensile strength (ability to resist breaking when stretched)?AlbuminActinSpider silkCollagen30s
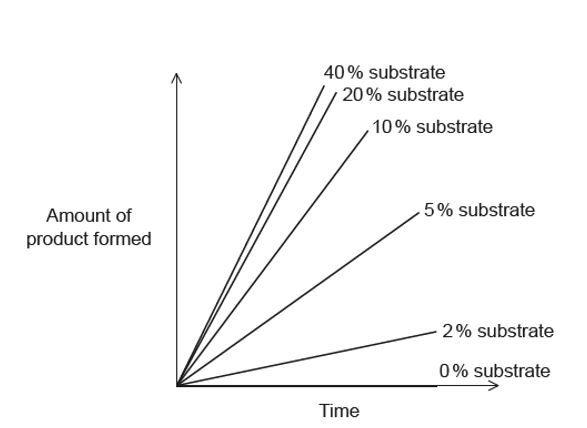
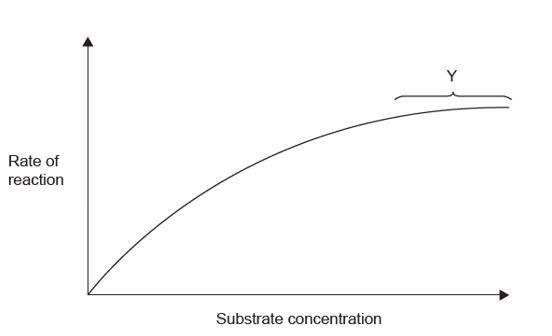
- Q6The graph shows the effect of changing the substrate concentration on the early stages of an enzyme-catalysed reaction. What can be interpreted about the rate of reaction from the graph?Rate of reaction increases linearly with increasing substrate concentration.Rate of reaction increases up to a point and then remains constant.Rate of reaction increases non-linearly with increasing substrate concentration.Rate of reaction is not affected by any change in the substrate concentration.30s
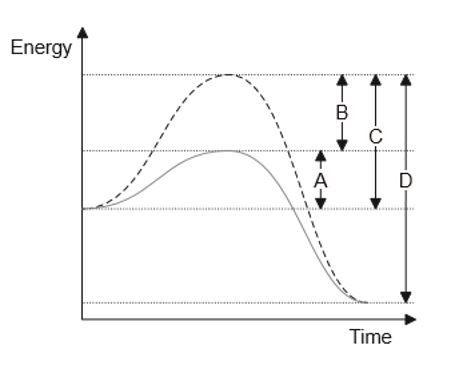
- Q7Which is the activation energy of a reaction when it is catalysed by an enzyme?cadb30s
- Q8Which statement correctly describes genome and proteome?Only mutations in the proteome but not in the genome cause any variability.In cells of different tissues, the genome is the same while the proteome varies.Only the genome but not the proteome can be analysed using gel electrophoresis.The genome and the proteome are the same in all tissues in an organism.30s
- Q9The graph shows the effect of increasing the substrate concentration on the rate of an enzyme-catalysed reaction. What is occurring during the phase indicated by section Y of the graph?The enzyme becomes denatured.The substrate concentration has risen too high.The optimum rate is reached.The active site of the enzyme is saturated.30s
- Q10How can the activity of a human amylase enzyme be increased during a laboratory experiment?Adding sugar to the mixtureAdding water to the mixtureIncreasing the temperature from 20 °C to 37 °CDecreasing the pH from 7 to 330s
- Q11It is possible to attach β-galactosidase to alginate beads for use in the production of lactose-free milk. What are enzymes that have been attached in this way called?CatalysedActivatedImmobilizedInhibited30s
- Q12Which is an effect of protein denaturation?The three-dimensional structure of the protein is altered.The bonds between amino acids are broken by condensation.Parts of the protein become linked together by hydrolysis.The order of amino acids is changed when the protein overheats.30s
- Q13How do R group interactions contribute to protein structure? I. Determining the sequence of amino acids in the primary structure II. Stabilizing beta pleated sheets in the secondary structure III. Stabilizing further foldings of a polypeptide into a tertiary structureI onlyI, II and IIIII and III onlyIII only30s
- Q14Which types of interactions are found in a part of a protein with secondary but not tertiary structure? I. Hydrogen bonds II. Disulphide bridges III. Ionic bondsII and III onlyI, II and IIII onlyI and II only30s
- Q15What effect do changes in pH have on enzymes?The activity of all enzymes is reduced by a pH below or above 7.Low pH causes reversible denaturation in all enzymes.All enzymes increase in activity as pH increases.Extreme pH can alter the active site of all enzymes.30s