Hazardous weather conditions include thunderstorms, tornadoes, hurricanes, ice storms, and blizzards. Humans can prepare for and respond to these conditions if given sufficient warning.
Track each student's skills and progress in your Mastery dashboards
Give this quiz to my class
Q 1/3
Score 0
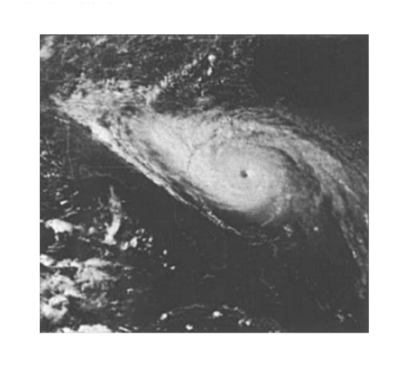
The photograph below shows a satellite image of a hurricane.
A satellite image of a hurricane helps weather forecasters to
60
predict the times of high tide and low tide
warn residents of hazardous weather
conditions
predict the total number of storms to occur
in one year
explain the effects of global warming on the
ocean currents
Q 2/3
Score 0
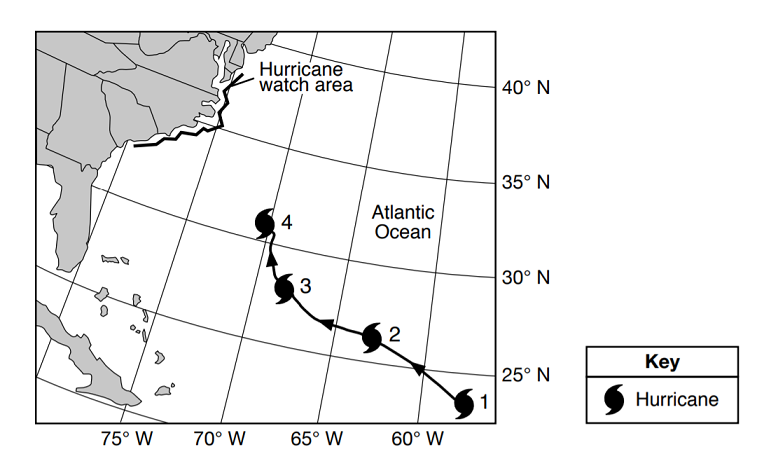
The map
shows the partial storm track of a hurricane and the hurricane watch area where it is predicted to reach land.
Numbers 1 through 4 show positions of the hurricane on four different days at 12 noon.
Why was a hurricane watch posted for the coastal areas shown?
60
to tell people where the hurricane started
to warn people of life-threatening conditions
to alert residents of climate changes
to encourage residents to travel to the watch area
3 questions
Q.
The photograph below shows a satellite image of a hurricane.
A satellite image of a hurricane helps weather forecasters to
1
60 sec
PS2.2q
Q.
The map
shows the partial storm track of a hurricane and the hurricane watch area where it is predicted to reach land.
Numbers 1 through 4 show positions of the hurricane on four different days at 12 noon.
Why was a hurricane watch posted for the coastal areas shown?
2
60 sec
PS2.2q
Q.
The map
shows the partial storm track of a hurricane and the hurricane watch area where it is predicted to reach land.
Numbers 1 through 4 show positions of the hurricane on four different days at 12 noon.
In which compass direction did the hurricane travel from day 1 to day 4?