Loading...
PSA 1 Review - Are you ready?
Quiz by Cecilia Argueta
Tag the questions with any skills you have. Your dashboard will track each student's mastery of each skill.
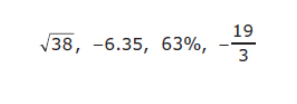
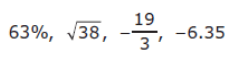
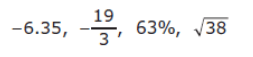
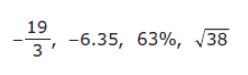
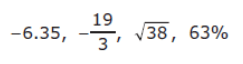
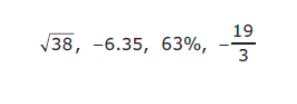
Which list shows these numbers in order from least to greatest?
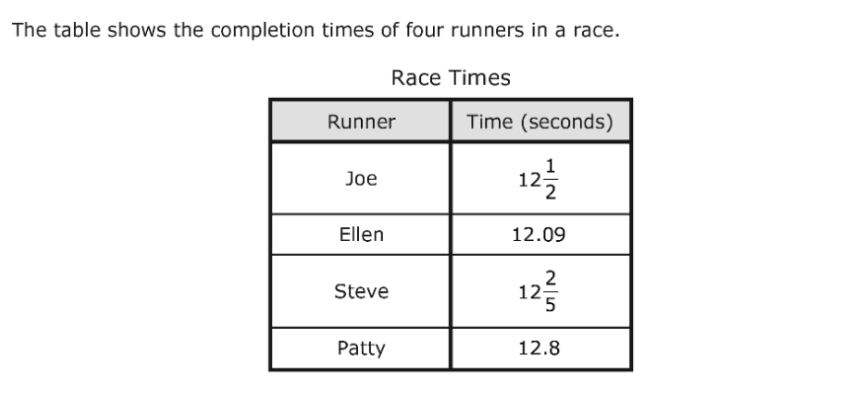
Which list shows the runners in order by their completion times from fastest to slowest? (*hint = faster runners have a shorter time (least))

Ellen, Joe, Steve, Patty
Patty, Joe, Steve, Ellen
Patty, Steve, Joe, Ellen
Ellen, Steve, Joe, Patty
Which list shows these numbers in order from least to greatest?
Which list shows the runners in order by their completion times from fastest to slowest? (*hint = faster runners have a shorter time (least))
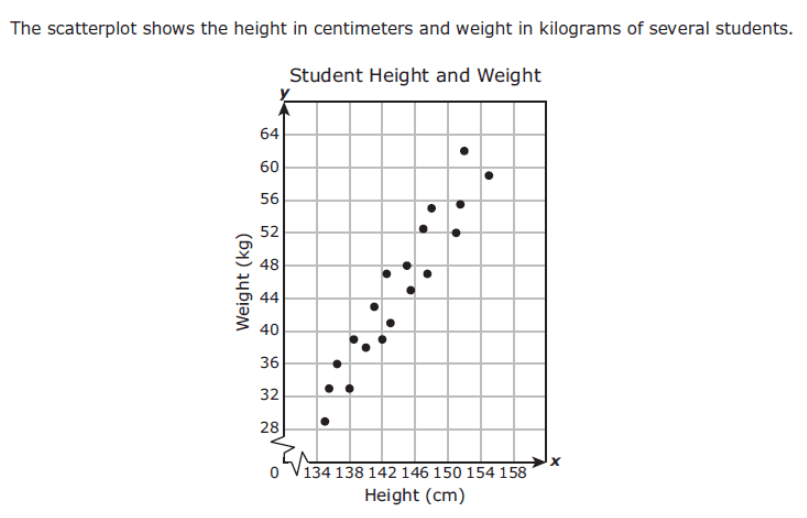
Based on the scatterplot, which is the best prediction of the height in centimeters of a student with weight of 64 kilograms?
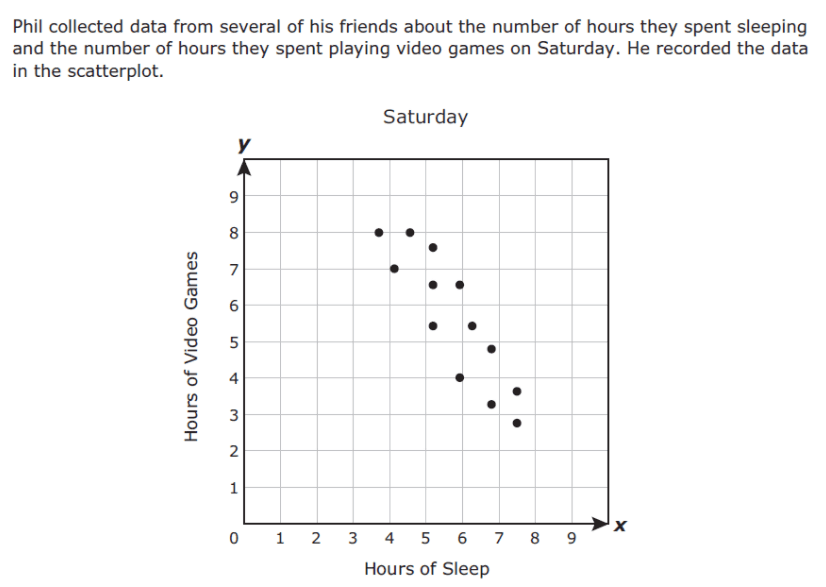
Based on the scatterplot, which is the best prediction of the number of hours one of Phil's friends spends sleeping when the friend spends 1 hour playing video games?
Based on the scatterplot, approximately what score should a student with 6 absences expect to receive on their final exam?

Which representation shows y as a function of x?
Which set of ordered pairs represents y as a function of x?
Which graph represents y as a function of x? (*hint: a vertical on top of a vertical lines touches a million times :))
A bottle contains 30 fluid ounces of orange juice and 18 ounces of pineapple juice. Which graph has a slope that best represents the ratio of orange juice to pineapple in this bottle?
Which statement best represents the rate of change for this situation? (*hint: rate of change is the same thing as slope)
A tree in Henry's neighborhood grew 18 inches in the first 2 years after it was planted. If the tree continues to grow at the same rate, which graph best represents the growth rate of the tree in inches per year?
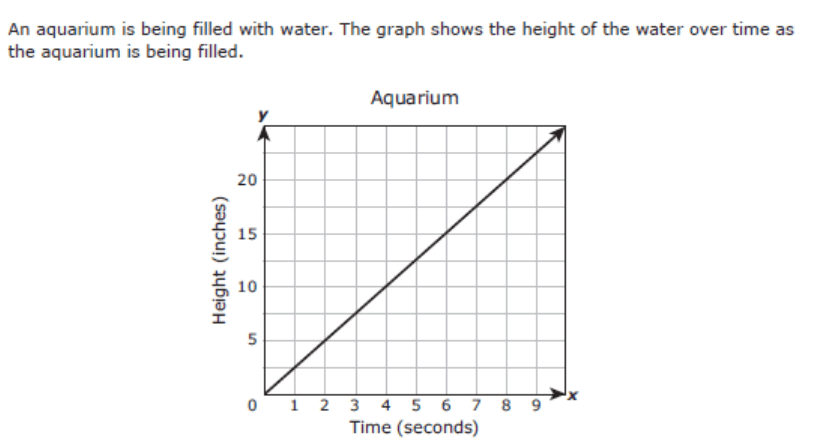
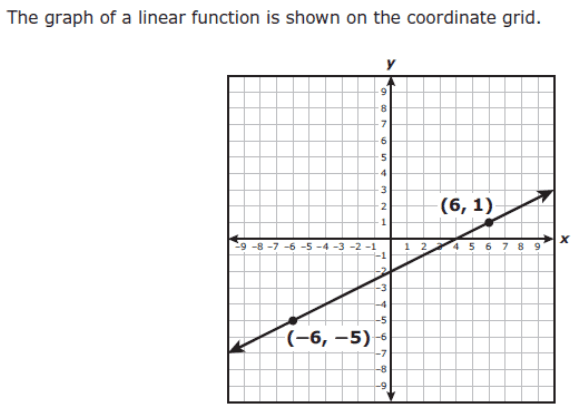
What is the y-intercept of the graph of this function?

What is the slope of the graph of this function in decimal form?
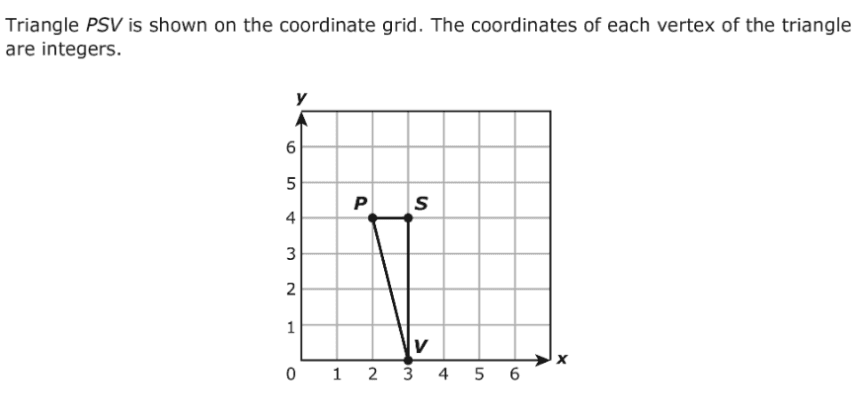
What is the slope from point P to V? (*hint: find the ordered pairs for both points)