Compare two fractions with the same denominator (limit denominators to 1, 2, 3, 4, 6, and 8), using the symbols >, =, or <, and/or justify the conclusions.
Recognize and generate simple equivalent fractions (limit the denominators to 1, 2, 3, 4, 6, and 8 and limit numerators to whole numbers less than the denominator). Example 1: 1/2 = 2/4 Example 2: 4/6 = 2/3
Interpret and/or describe whole-number quotients of whole numbers (limit dividends through 50 and limit divisors and quotients through 10). Example 1: Interpret 48 ÷ 8 as the number of objects in each share when 48 objects are partitioned equally into 8 shares, or as a number of shares when 48 objects are partitioned into equal shares of 8 objects each. Example 2: Describe a context in which a number of shares or a number of groups can be expressed as 48 ÷ 8.
Solve mathematical and realworld problems using multiplication and division, including determining the missing number in a multiplication and/or division equation.
Apply the commutative property of multiplication (not identification or definition of the property).
Solve two-step word problems using the four operations (expressions are not explicitly stated). Limit to problems with whole numbers and having whole-number answers.
Create or match a story to a given combination of symbols (+, –, ×, ÷, <, >, and =) and numbers.
Calculate elapsed time to the minute in a given situation (total elapsed time limited to 60 minutes or less).
Use a ruler to measure lengths to the nearest quarter inch or centimeter.
Round amounts of money to the nearest dollar.
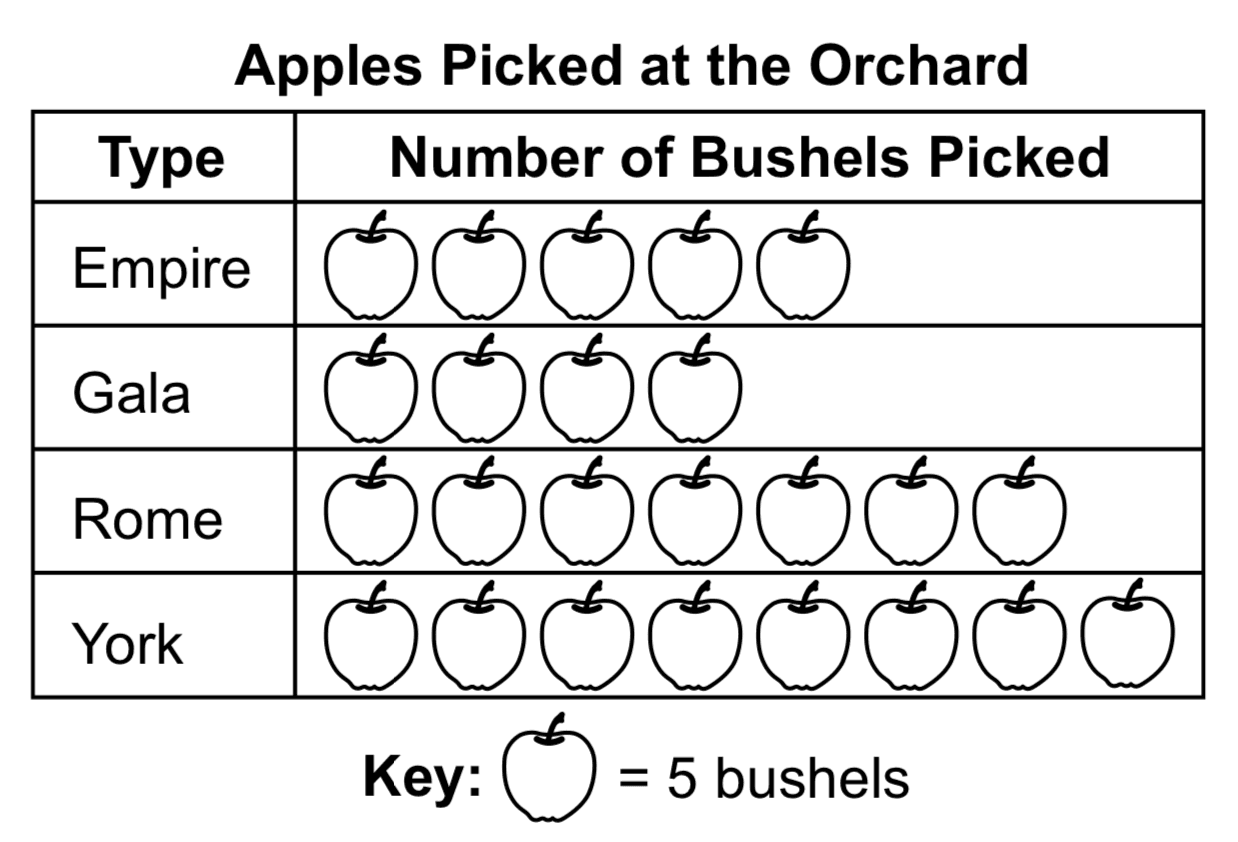
Solve one- and two-step problems using information to interpret data presented in scaled pictographs and scaled bar graphs (scales limited to 1, 2, 5, and 10). Example 1: (One-step) “Which category is the largest?” Example 2: (Two-step) “How many more are in category A than in category B?”
Generate measurement data by measuring lengths using rulers marked with halves and fourths of an inch. Display the data by making a line plot, where the horizontal scale is marked in appropriate units—whole numbers, halves, or quarters.
Translate information from one type of display to another. Limit to pictographs, tally charts, bar graphs, and tables. Example: Convert a tally chart to a bar graph.
Solve real-world and mathematical problems involving perimeters of polygons, including finding the perimeter given the side lengths, finding an unknown side length, exhibiting rectangles with the same perimeter and different areas, and exhibiting rectangles with the same area and different perimeters. Use the same units throughout the problem.
Track each student's skills and progress in your Mastery dashboards