
PSSA Grade 7 Math - M07.D-S.3.2.2
Quiz by PSSA Grade 7 Math
Grade 7
Math
Pennsylvania Assessment Anchors and Eligible Content
Feel free to use or edit a copy
includes Teacher and Student dashboards
Measures 1 skill from
Track each student's skills and progress in your Mastery dashboards
With a free account, teachers can
- edit the questions
- save a copy for later
- start a class game
- automatically assign follow-up activities based on students’ scores
- assign as homework
- share a link with colleagues
- print as a bubble sheet
5 questions
Show answers
- Q1
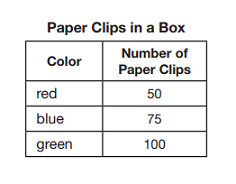
The number of paper clips of each color in a box is shown in the table below. Margo randomly selects 1 paper clip from the box, records its color, and returns it to the box. She does this 10 times. Which table shows experimental results from Margo's selections that are CLOSEST to the expected results when based on the probabilities of selecting a paper clip of each color from the box?60sM07.D-S.3.2.2
- Q260sM07.D-S.3.2.2
- Q360sM07.D-S.3.2.2
- Q460sM07.D-S.3.2.2
- Q560sM07.D-S.3.2.2