Loading...
Q4 Mathematics 6 Module 4 Summative Test
Quiz by Christine Jerenlou Pedroso
Track each student's skills and progress in your Mastery dashboards
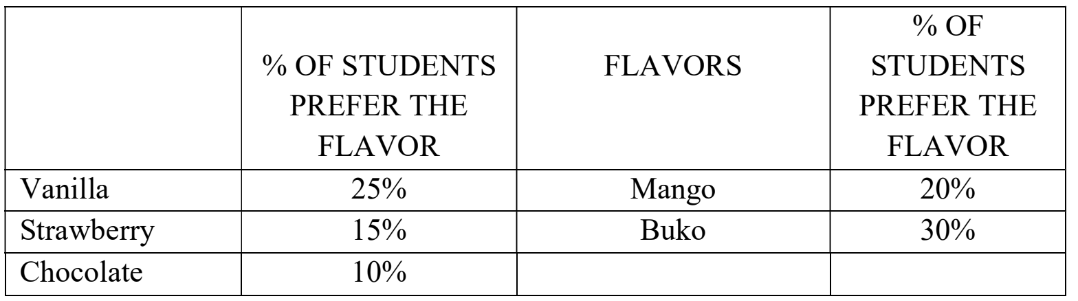
For numbers 1-4. The favorite flavors of ice cream for the children in locality are given in percentage as follows.
If you draw a pie graph to the given data above, what is the angle measure for buko flavor?
98 ̊
108 ̊
208 ̊
308 ̊
For numbers 1-4. The favorite flavors of ice cream for the children in locality are given in percentage as follows.
What is the angle measure of Vanilla flavor?
100 ̊
90 ̊
45 ̊
25 ̊
For numbers 1-4. The favorite flavors of ice cream for the children in locality are given in percentage as follows.
If you draw a pie graph to the given data above, what is the angle measure for buko flavor?

For numbers 1-4. The favorite flavors of ice cream for the children in locality are given in percentage as follows.
What is the angle measure of Vanilla flavor?
For numbers 1-4. The favorite flavors of ice cream for the children in locality are given in percentage as follows.
If there are 60 pupils in all, how many pupils like Strawberry flavor?
For numbers 1-4. The favorite flavors of ice cream for the children in locality are given in percentage as follows.
How many pupils want Mango and Chocolate flavors in 60 pupils?
For numbers 1-4. The favorite flavors of ice cream for the children in locality are given in percentage as follows.
What is the angle measure of the whole circle?
For questions 6-10, refer to the given pie graph. The pie graph shows the favorite sports of Malanday Elementary School teachers and staff.
What sports is the most favorite?

For questions 6-10, refer to the given pie graph. The pie graph shows the favorite sports of Malanday Elementary School teachers and staff.
What is the least favorite sports?
For questions 6-10, refer to the given pie graph. The pie graph shows the favorite sports of Malanday Elementary School teachers and staff.
If there are 140 teachers and staff, how many choose badminton as their favorite sports?
For questions 6-10, refer to the given pie graph. The pie graph shows the favorite sports of Malanday Elementary School teachers and staff.
How many choose badminton and table tennis as their favorite sports? (Refer to the number of teachers and staff in number 8)
For questions 6-10, refer to the given pie graph. The pie graph shows the favorite sports of Malanday Elementary School teachers and staff.
The following are some of the advantages of playing sports. Which is not?
For numbers 11-14. The following pie chart shows a survey of the numbers of cars, buses and motorcycles that passes a particular junction. There were 150 buses in the survey.
Data in degree measure Motorcycles - 210 ̊, buses - 30 ̊, cars - 110 ̊, other - 10 ̊
What fraction of the vehicles were motorcycles?

For numbers 11-14. The following pie chart shows a survey of the numbers of cars, buses and motorcycles that passes a particular junction. There were 150 buses in the survey.
Data in degree measure Motorcycles - 210 ̊, buses - 30 ̊, cars - 110 ̊, other - 10 ̊
What percentage of vehicles passing by the junction were cars?
For numbers 11-14. The following pie chart shows a survey of the numbers of cars, buses and motorcycles that passes a particular junction. There were 150 buses in the survey.
Data in degree measure Motorcycles - 210 ̊, buses - 30 ̊, cars - 110 ̊, other - 10 ̊
If there are 1800 vehicles, how many buses are there?
For numbers 11-14. The following pie chart shows a survey of the numbers of cars, buses and motorcycles that passes a particular junction. There were 150 buses in the survey.
Data in degree measure Motorcycles - 210 ̊, buses - 30 ̊, cars - 110 ̊, other - 10 ̊
How many motorcycles are there if there are 1800 vehicles in all?
How many percent is a 90 ̊ sector of a circle graph?
For numbers 16-19, refer to the table below. The table shows the favorite sports of 6 – Dalisay.
If you will draw a pie graph to the given data, what is the angle measure for basketball?

For numbers 16-19, refer to the table below. The table shows the favorite sports of 6 – Dalisay.
How many percent of pupils chose table tennis as their sports?
For numbers 16-19, refer to the table below. The table shows the favorite sports of 6 – Dalisay.
What is the angle measure of badminton if you will show the data through pie graph?
For numbers 16-19, refer to the table below. The table shows the favorite sports of 6 – Dalisay.
What sports occupies the greatest sector of the pie graph?
What is the angle measure equivalent to 50% in a pie graph?