Loading...
Q4M3_What I Know!!
Quiz by Maribel Marzan
Track each student's skills and progress in your Mastery dashboards
Which process is used in grouping data into categories showing the number of observations in each of the non-overlapping classes?
What is the difference between the highest value and the lowest value in a distribution?
What is the range of the given set of data 4, 6, 9, 8, 7, 4, 6, 5, 5, 8, 12, 20?
Which is being computed by getting the average of the class limits?
What is the class mark of the class with the highest frequency?

What is the upper limit of the class with a class mark of 162?
What is the class width of the distribution?
What is the upper boundary of the lowest class?

Which class has the greatest frequency?
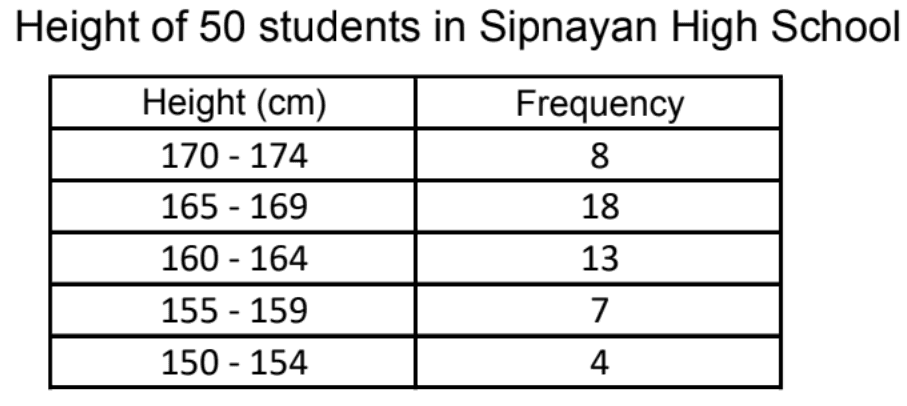
What is the class mark of the lowest class?