Loading...
Q4-M5-Correlation-Summative Test
Quiz by MARITESS ZARA
Track each student's skills and progress in your Mastery dashboards
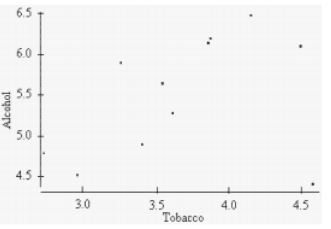
A scatter plot shows
Couples who share more similar attitudes indicate that they are more satisfied with their relationship. This reflects a ___________ correlation.
Correlation is _____type of statistical analysis.
What would you expect the correlation between daily calorie consumption and body weight to be?
The diagram below is an example of a
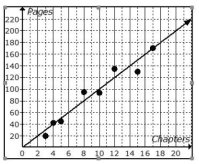
The scatter plot shows the relationship between the number of chapters and the total number of pages for several books. Use the trend line to predict how many chapters would be in a book with 180 pages.
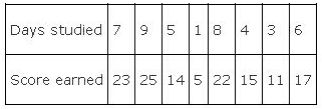
What does the data you created in your scatter plot imply?
Rank these scatter plots according to the intensity of the correlation represented, from weakest to strongest

This measure how strong or weak the relationship between two variables is.
What is the relationship of this statement: The temperature outside and the number of layers of clothes you need to stay warm.