Quadratic, Linear, and Exponential to Equations
Quiz by Sofia Guerrero
Feel free to use or edit a copy
includes Teacher and Student dashboards
Measure skillsfrom any curriculum
Tag the questions with any skills you have. Your dashboard will track each student's mastery of each skill.
- edit the questions
- save a copy for later
- start a class game
- automatically assign follow-up activities based on students’ scores
- assign as homework
- share a link with colleagues
- print as a bubble sheet
- Q 1/12Score 0
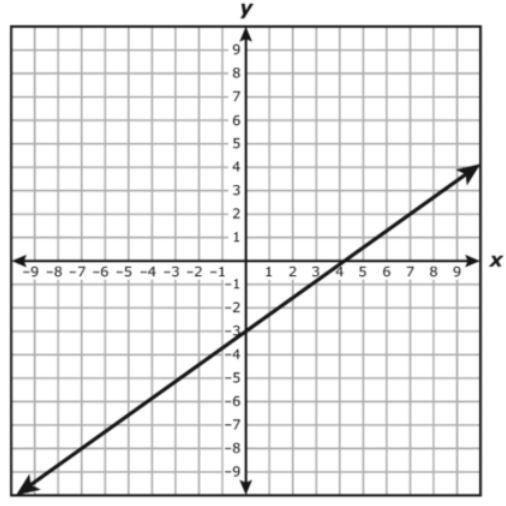
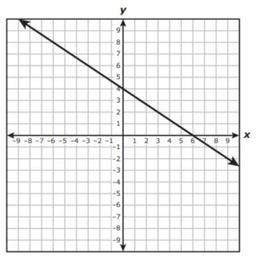
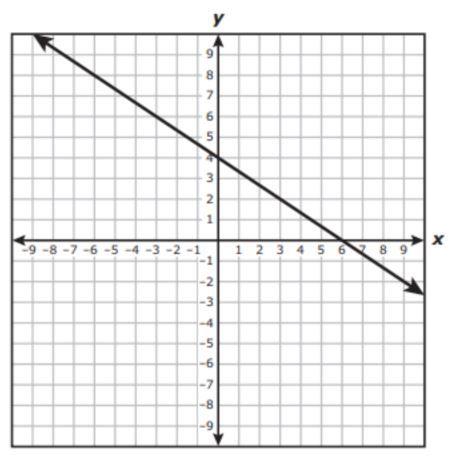
The graph of a linear function is shown on the grid. Which function is best represented by this graph?
29


- Q1
The graph of a linear function is shown on the grid. Which function is best represented by this graph?
120s - Q2
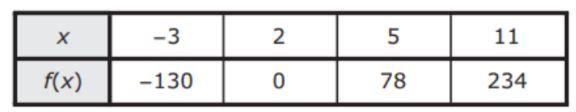
The table represents some points on the graph of linear function f. Which function represents f?
120s - Q3
The graph of a linear function is shown on the grid. Which equation is best represented by this graph?
120s - Q4
The table shows the amount of� pet food in cups remaining in an automatic feeder as a function of the number of meals the feeder has dispensed.�
Based on the table, which function models this situation?
120s - Q5
At a restaurant jars of tomato sauce are stored in boxes in the pantry. Each box contains 8 jars of tomato sauce. A cook uses 2 jars from 1 of the boxes.�
Which function shows the relationship between y, the total number of jars of tomato sauce remaining in the pantry, and x, the number of boxes in the pantry?
120s - Q6
The table represents some points on the graph of a linear function. Which equation represents the same relationship?
120s - Q7
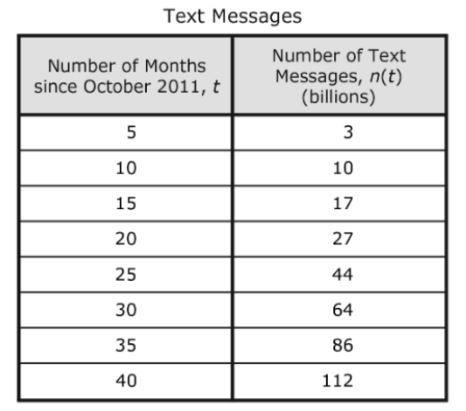
A company collected data for the number of text messages sent and received using a text-message application since October 2011. The data table shows the number of text messages sent and received in billions over time. The data can be modeled by a quadratic function.�
Which function best models the data?
120s - Q8
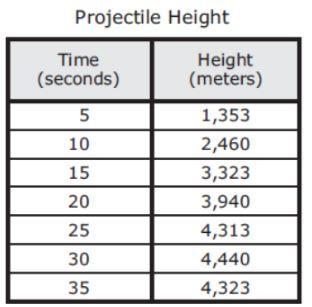
A projectile is launched into the air from the ground. The table shows the height of the projectile, h(t), at different times.�
Based on the table, which function can best be used to model this situation?
120s - Q9
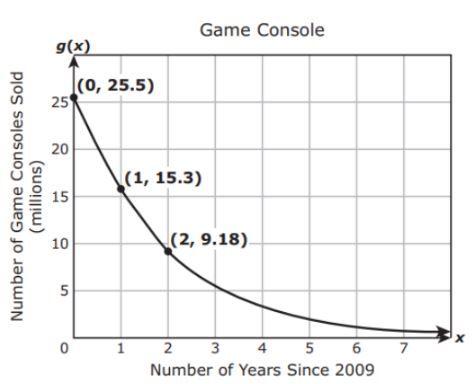
The graph shows the number of game consoles sold in millions since 2009. Based on the information, which function best models the number of game consoles sold in millions x�years since 2009?
120s - Q10
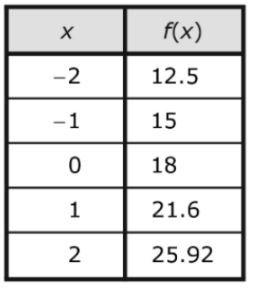
The table represents some points on the graph of an exponential function.
Which function represents this relationship?
120s - Q11
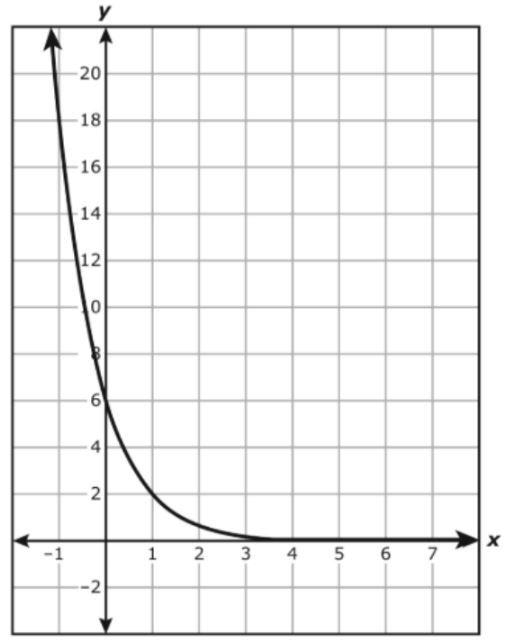
An exponential function is graphed on the grid.�
Which function is best represented by the graph?
120s - Q12
The table represents some points on the graph of an exponential function.�
Which function represents the same relationship?
120s