Tag the questions with any skills you have. Your dashboard will track each student's mastery of each skill.
Give this quiz to my class
Q 1/20
Score 0
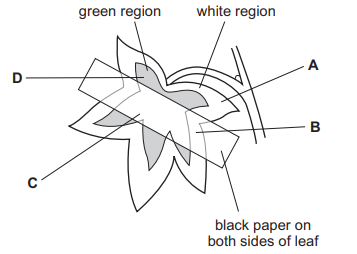
A plant with variegated leaves has the starch removed from its leaves by placing it in a dark cupboard for 48 hours.
Black paper is then fixed on one leaf as shown and the plant is exposed to light.
After 24 hours, which part of the leaf contains starch?
60
B
D
C
A
Q 2/20
Score 0
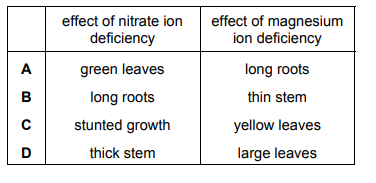
Which row shows the effects of deficiencies in nitrate and magnesium ions on plant growth?
60
C
B
A
D
20 questions
Q.
A plant with variegated leaves has the starch removed from its leaves by placing it in a dark cupboard for 48 hours.
Black paper is then fixed on one leaf as shown and the plant is exposed to light.
After 24 hours, which part of the leaf contains starch?
1
60 sec
Q.
Which row shows the effects of deficiencies in nitrate and magnesium ions on plant growth?
2
60 sec
Q.
The lower end of a plant stem is placed in water coloured with red dye. After three hours, the stem is cut as shown in the diagram.
Which labelled region is stained red?
3
60 sec
Q.
By which process is water lost from a leaf?
4
60 sec
Q.
Two similar leaves are set up in test-tubes as shown. One is exposed to light, while the other is kept in the dark. After a few hours, which colour would the hydrogen carbonate indicator solution be in each tube?
5
60 sec
Q.
Which graph shows most clearly what will happen to the rate of transpiration as humidity increases?
6
60 sec
Q.
The diagram shows a potted plant and the same plant 24 hours later. What causes the change in the appearance of the plant?
7
60 sec
Q.
For the stomata of a leaf to open, the guard cells accumulate more potassium ions than the surrounding cells.
Which row describes what happens?
8
60 sec
Q.
The diagram shows how the rate of photosynthesis varies with light intensity.
The four curves show different conditions of temperature and carbon dioxide concentration. What limits the rate of photosynthesis at point P?
9
60 sec
Q.
The diagram shows part of a leaf in cross-section.
What shows the correct function of a numbered part?
10
60 sec
Q.
The roots of plants take up nitrates from the soil.
What are the nitrates used to make?
11
60 sec
Q.
The diagrams show stages in the passage of water through a plant.
Which arrow shows water moving in the form of water vapour?
12
60 sec
Q.
Curve X on the graph shows the effect of light intensity on the rate of photosynthesis.
How have the conditions changed to produce curve Y?
13
60 sec
Q.
An experiment is set up to investigate gas exchange in aquatic plants. The hydrogen carbonate indicator solution is orange at the start.
Which colour is it after three hours?
14
60 sec
Q.
A plant shoot is placed in a solution of a dye.
The dye moves up the stem.
Under which conditions will the dye move slowest?
15
60 sec
Q.
Which changes in atmospheric conditions can cause a plant to wilt?
16
60 sec
Q.
The diagram shows a leaf as seen in cross-section under the microscope.
What are tissues 1, 2 and 3?
17
60 sec
Q.
How does a plant use the sugar that it makes?
18
60 sec
Q.
The diagram shows a section through a leaf.
Which arrow shows the direction of diffusion of carbon dioxide on a sunny day?
19
60 sec
Q.
The diagrams show cross-sections through a root and a stem.
Which labels are correct?